LS-2-P-2357 Human neutrophil activation by Kojic Acid
Neutrophils has a crucial role on cell physiology and act as professional phagocytes to eliminate pathogens. During the cell activation, morphological and physiological changes results in various antimicrobial effectors mechanisms and production of superoxide anion and other reactive oxygen species can be upregulated. The Kojic Acid (KA) is a secondary metabolite synthesized by some species of fungi that has several applications, largely used as a food additive, tyrosinase inhibitor and macrophage activator. The aim of this study was to perform an in vitro analysis of human neutrophils activation by KA. Human neutrophils were isolated from buffy coats of healthy human donors by density sedimentation (Histopaque® 1077-density-gradient). Neutrophils were treated for 1 hour with 50 μg/mL of KA and positive control cells were treated with 100 nM of phorbol 12-myristate 13-acetate (PMA) and compared with control without treatment. The morphological analyses were performed by optical microscopy (Figure 1), scanning electron microscopy and transmission electron microscopy (Figure 2). Before the treatment cells exhibited rounded shape that changed to a polarized morphology with many cells exhibiting an increase of the cell volume, membrane projections and high spreading ability (Figure 1 and 2). Treated cells analyzed by immunofluorescence microscopy showed enhanced spreading, associated with a rearrangement of actin filaments (Figure 3). For superoxide detection, treated neutrophils were analyzed with a cytochemical assay using nitroblue tetrazolium salt (NBT). Treated cells showed formazan deposits distributed in the cellular cytoplasm, showing intense superoxide production (Figure 4C), in comparison with the untreated cells (Figure 4A). The similar results were observed to positive control treated with PMA (Figure 4B). The reaction was observed in approximately in 75% of the KA-treated cells. Increase ROS production was detected by labeling with CellROX® green. The number of CellROX labeled cells was superior to untreated cells (Figure 4E), revealing that KA stimulated a large production of ROS. In conclusion, this study demonstrates that KA significantly induced neutrophils activation.
CAPES, CNPq, UFPa , Instituto Nacional de Biologia estrutural e Bioimagem, PRONEX/FAPESPA/CNPq,Ministério da Saúde-MS
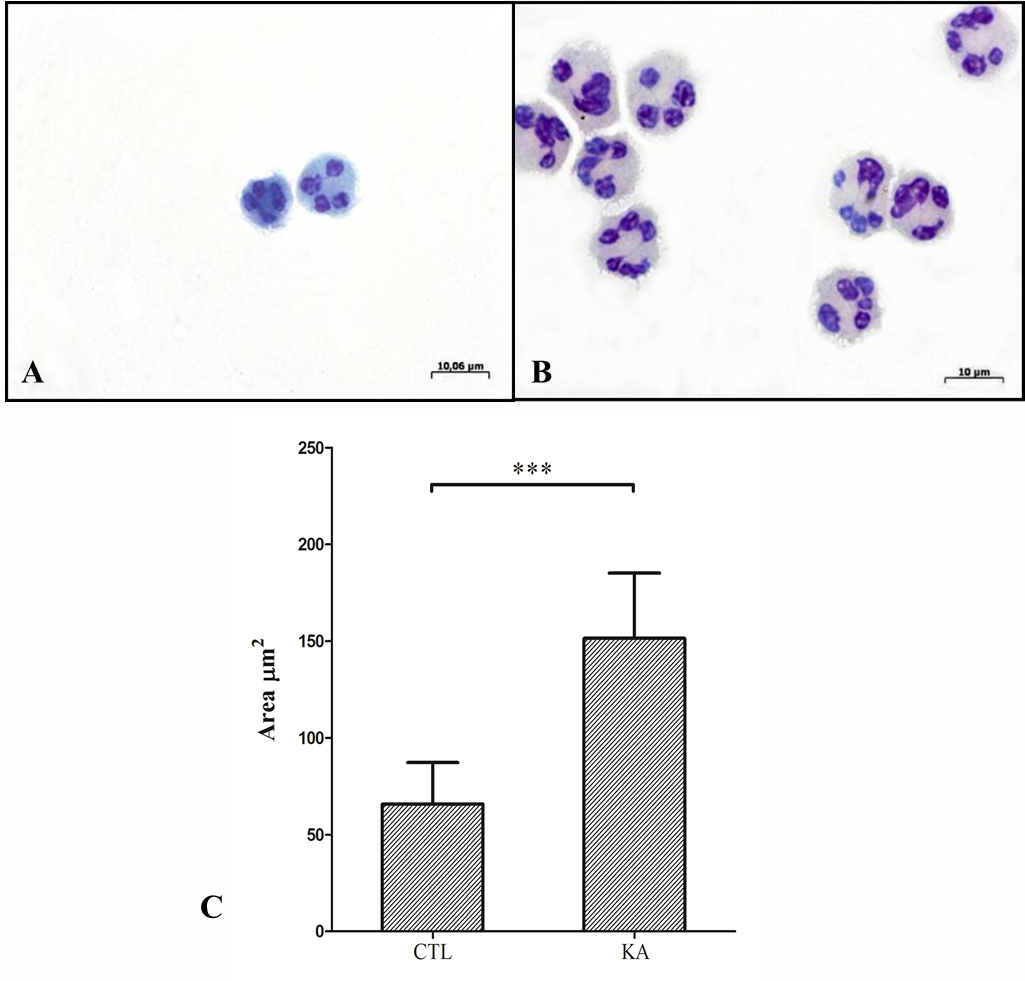
Fig. 1: The morphological analysis by optical microscopy (A-B) and Morphometric analysis (C). (A) Control cells with typical morphology (B) Neutrophils treated with 50 µg/mL of KA. (C) Morphometric analysis showed a significant increased in the cell area when neutrophils were treated with 50 µg/mL KA. Test T was used. (*) P <0.05. Bar: 10 μm. |
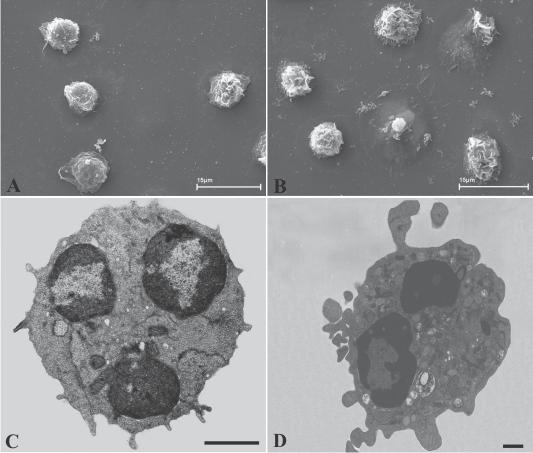
Fig. 2: The morphological analysis by scanning electron microscopy (A-B) and transmission electron microscopy (C-D). (A,C) Control cells with typical morphology (B,D) Neutrophils treated with 50 µg/mL of KA. Treated cells with extensive cytoplasmic projections and increase of cell volume. Bar: 2,5 μm. |
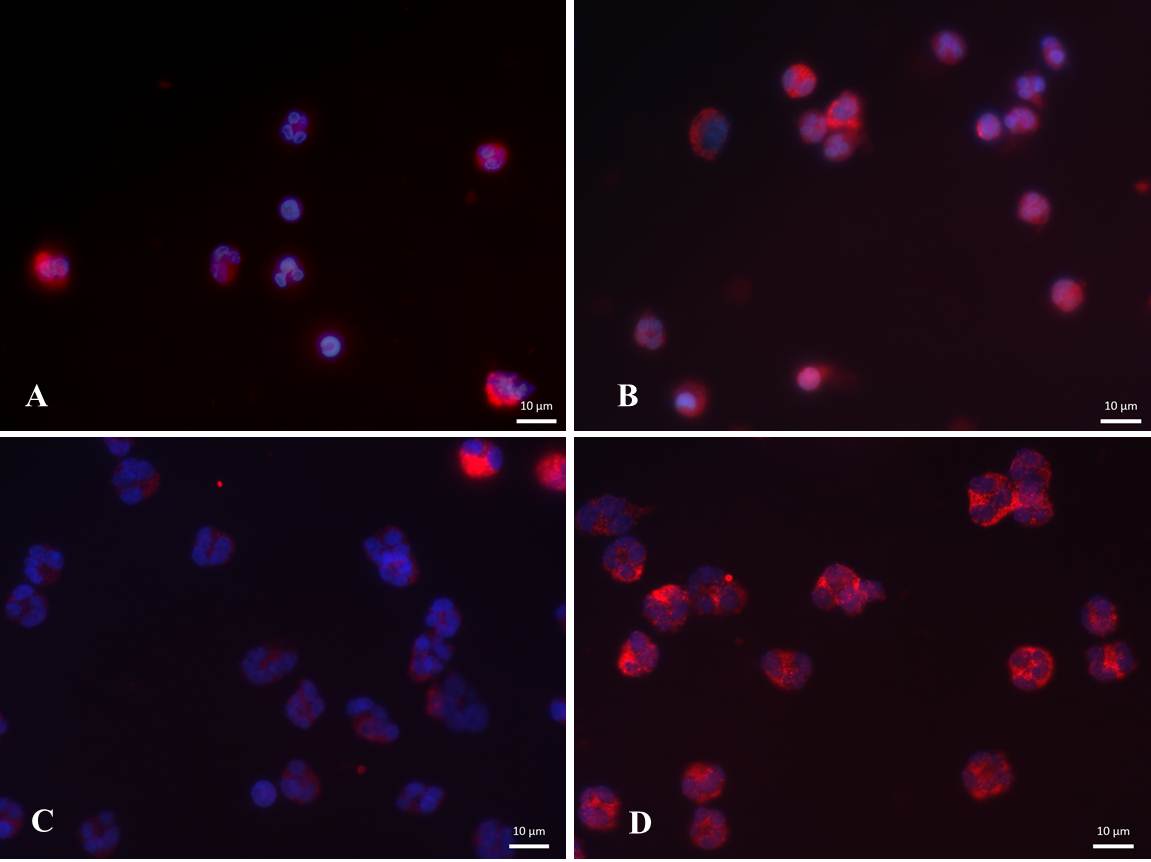
Fig. 3: Actin filaments detected by fluorescence in neutrophils exposed to 50 mg/mL KA for 1 h (A–C) Fluorescence labelling of actin filaments with phalloidin and DAPI in untreated cells (B-D), KA-treated cells (B-D) with enhanced filopodium establishment. Bars: 10 μm. |
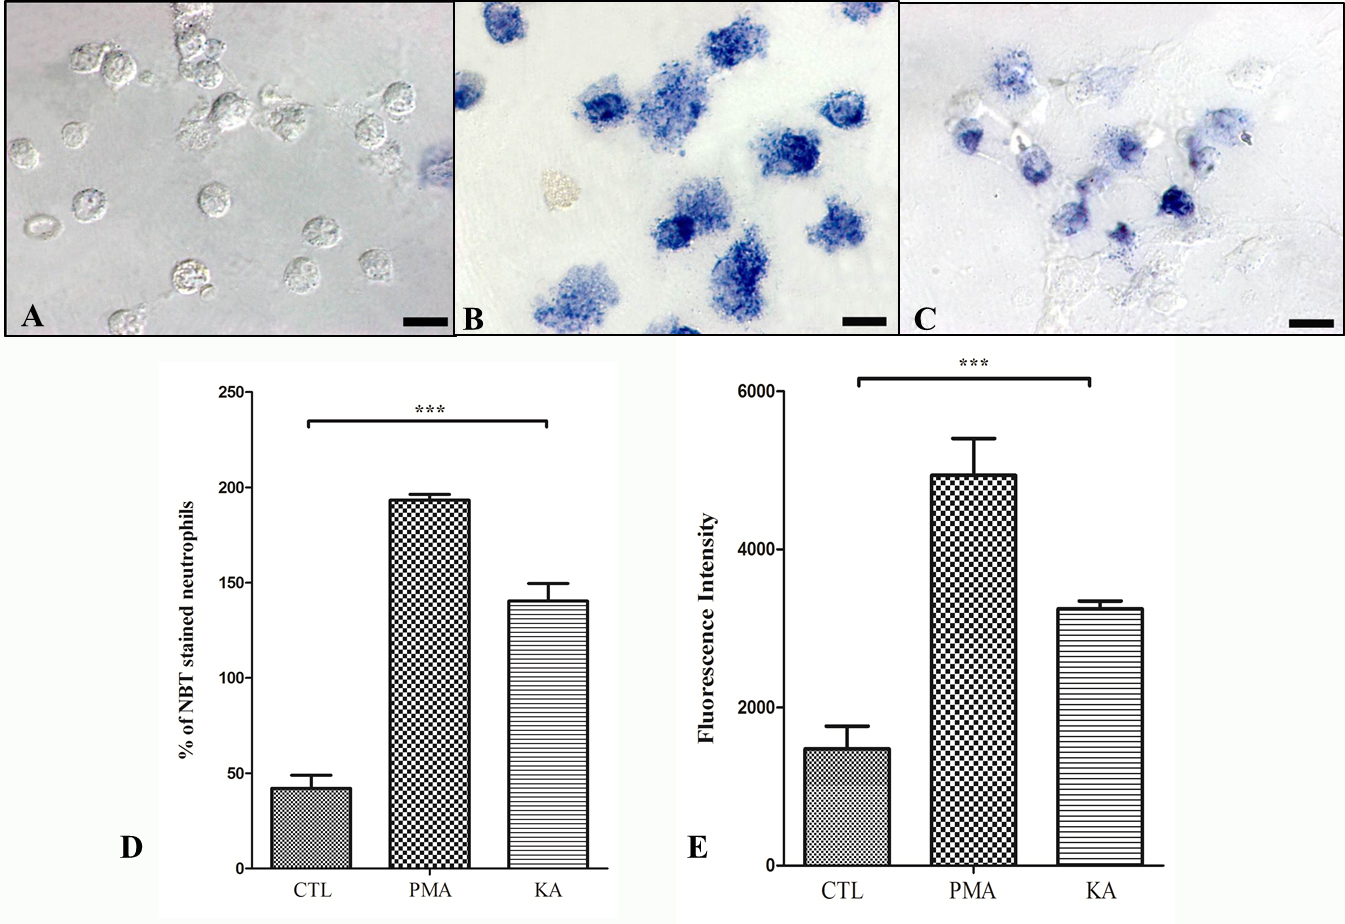
Fig. 4: Detection of Superoxide production by NBT assay (A-D) and ROS Production by CellROX® (E). (A) Non-treated neutrophils;(B) Cells treated with 100 nM PMA; (C) Neutrophils treated with 50 µg/mL KA. Bars: 10 μm (D)Number of neutrophils that presented formazan deposits (E)The number of CellROX labeled cells. ANOVA was used. (*) P <0.05. |