IT-4-P-6025 Two customized low-cost systems for STEM in SEM microscopy
Scanning transmission electron microscopy (STEM) has become an established technique in microscopy, combining the transmission mode with the sample scanning (Bogner 2007). Although STEM can be performed in dedicated facilities, it is possible to implement it on existing SEM microscopes (STEM-in-SEM) in a relatively simple and cheap way (Vanderlinde 2004). Two customized low-cost stages for STEM-in-SEM microscopy are presented with some representative images obtained from material and life science.
The systems were optimized for a XL 30 FEI, but they can be easily adapted to other microscopes with minor modifications. STEM Signal is detected by the back-scattered electron detector (BSED) or the secondary electrons detector (SED). TEM grids fit in both systems. The first system (STEM-A) (Fig. 1a) was adapted from the configuration proposed by Merli and Morandi in 2005. An aluminium table is mounted on four columns screwed in the x-y stage. The grid is placed in a 2.5 mm hole at a working distance of 10 mm. An aluminium ring blocks the grid. The BSED is cemented on the original sample older allowing to adjust the BSED-grid distance by regulating the z stage axis. To obtain both dark-field (DF) or bright-field (BF) images, BSED should be centred respectively on or off the beam axis. The second system (STEM-B) (Fig. 1b) was derived from the configuration proposed by Golla at al. in 1994. The beam is focused on the sample via a graphite tunnel that attenuate SE signal (different tunnel heights allow choosing the optimal SE-TE signals ratio). Transmitted electrons are scattered back to the SED by two gold-sputterd coverglasses.
STEM-A proved better results with high beam voltage (>20 KV), guaranteeing a sufficient transmitted signal. A distance from 30 to 40 mm between sample and detector gave best results. Details down to 20 nm can be easily resolved (Fig. 2a ). BF and DF images provide complementary information. STEM-B with tunnels of different heights allowed various advantages. The shortest tunnel provides a better image quality, even though a SE signal was also present (Fig. 2b). Deeper tunnels allowed to collect pure TE signal. A less sensitivity to spot size was found in respect to the STEM-B (spot size of 2.0 or 3.0 can be used for magnification up to 100000x). It proved to work with both low and high voltages providing suitable electron transparent sample (Fig. 3) No DF images are available with this system.
Both STEM in SEM system are cheap and offer different configurations that can be adapted to sample characteristics, allowing to achieve good resolution and contrast with conventional SEM microscopes for sample screening before analysis with TEM or high-resolution dedicated STEM.
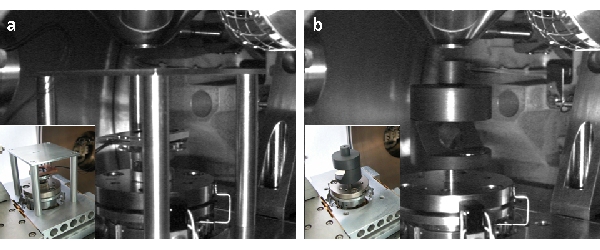
Fig. 1: STEM in SEM systems: STEM-A (a) and STEM-B (b) inside the closed (open in the insets) chamber of a XL 30 (FEI). Transmitted electrons signal is collected by BSE or SE detectors, respectively. |
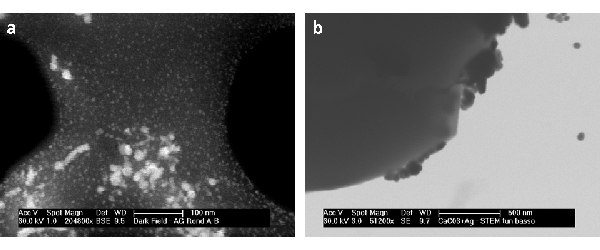
Fig. 2: Ag nano-particles on a holey carbon film coated grid imaged with the STEM-A system. Dark field image (a). Ag nano-particles on the surface of a CaCO3 micro-particle imaged by the STEM-B system equipped with the short graphite tunnel. Bright field image (b). Original magn. 204800x (a) and 51200x (b). |
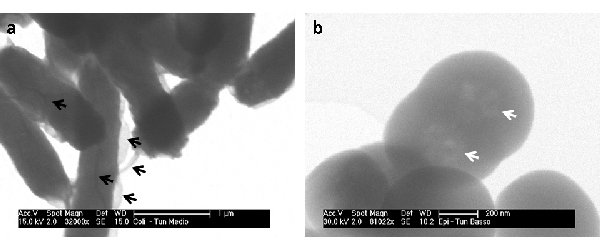
Fig. 3: Escherichia coli (a) and Staphylococcus epidermidis (b) cells imaged by the STEM-B system equipped with the short graphite tunnel. Samples were alcohol fixed, dehydrated, unstained. Microstructural details of cell surface (cell pili, black arrows), and inner structures (chromatin, white arrows) are visible. Original magn. 32000x (a) and 81000x (b). |
|