IT-1-P-6004 Determinationof geometrical form factor of emitter from Schottky plot
In this paper we report preliminary experimental results on a LaB6 Schottky emission electron gun, which also includes our new findings that the electric field strength on the emitter surface can be estimated experimentally from the Schottky plot whose slope depends not on the work function but only on the reciprocal of the emitter temperature. According to the theoretical considerations on the Schottky emission, if the values of log10 j (j: emission current density) are plotted as a function of √F (F: field strength on the emitter surface), then the graph becomes a straight line with the slope of 1.913/T (T: emitter temperature), which is known as “the theoretical Schottky plot”. In experiment, on the other hand, the beam current I is measured as a function of the extraction voltage Va. Thus, the slope of “the experimental Schottky plot” is different from that of “the theoretical Schottky plot”. From I = j × ΔS (ΔS: emission area on emitter surface), the vertical axis of “the experimental Schottky plot” is expressed as log10 j + log10 ΔS, which means the graph is moved parallel to the vertical direction without changing the slope of the graph. We mark a new scale on the horizontal axis of “the experimental Schottky plot” in order that the slope may be equal to 1.913/T. Then, the new horizontal axis should be graduated in √F. This procedure makes it possible to relate the field strength F directly to the extraction voltage Va as F = β Va, where β is the geometrical form factor of the emitter.
The Schottky emission experiment has been done in the ultra-high vacuum chamber, using the experimental circuit shown in Fig. 1. A flat top LaB6 emitter is embedded into a rhenium conical sheath, and is heated by a tungsten hairpin filament, as shown in Fig. 1.
The beam current IF was measured as a function of the extraction voltage Va for a constant emitter temperature T = 1600 K by the Faraday cup placed behind the fluorescent screen. In Fig. 2, the values of log10 IF are plotted as a function of √Va. It can be seen that the plot is almost a straight line, which indicates that the emission is under Schottky emission mode. Figure 2 (a) and (b) also show emission patterns observed on the fluorescent screen at Va = 2 kV and 5 kV, respectively.
Figure 3 shows the above procedures, where the new horizontal axes scaled in √F are placed in addition to the original horizontal axes scaled in √Va. From the relation between F and Va, we have found that β = 99.6 [1/cm] for T = 1600 K. We have also performed the field calculation for the experimental system shown in Fig. 1. According to the calculation, the geometrical form factor β has been found to be β = 95.0 [1/cm], which is in good agreement with that estimated from “the experimental Schottky plot”.
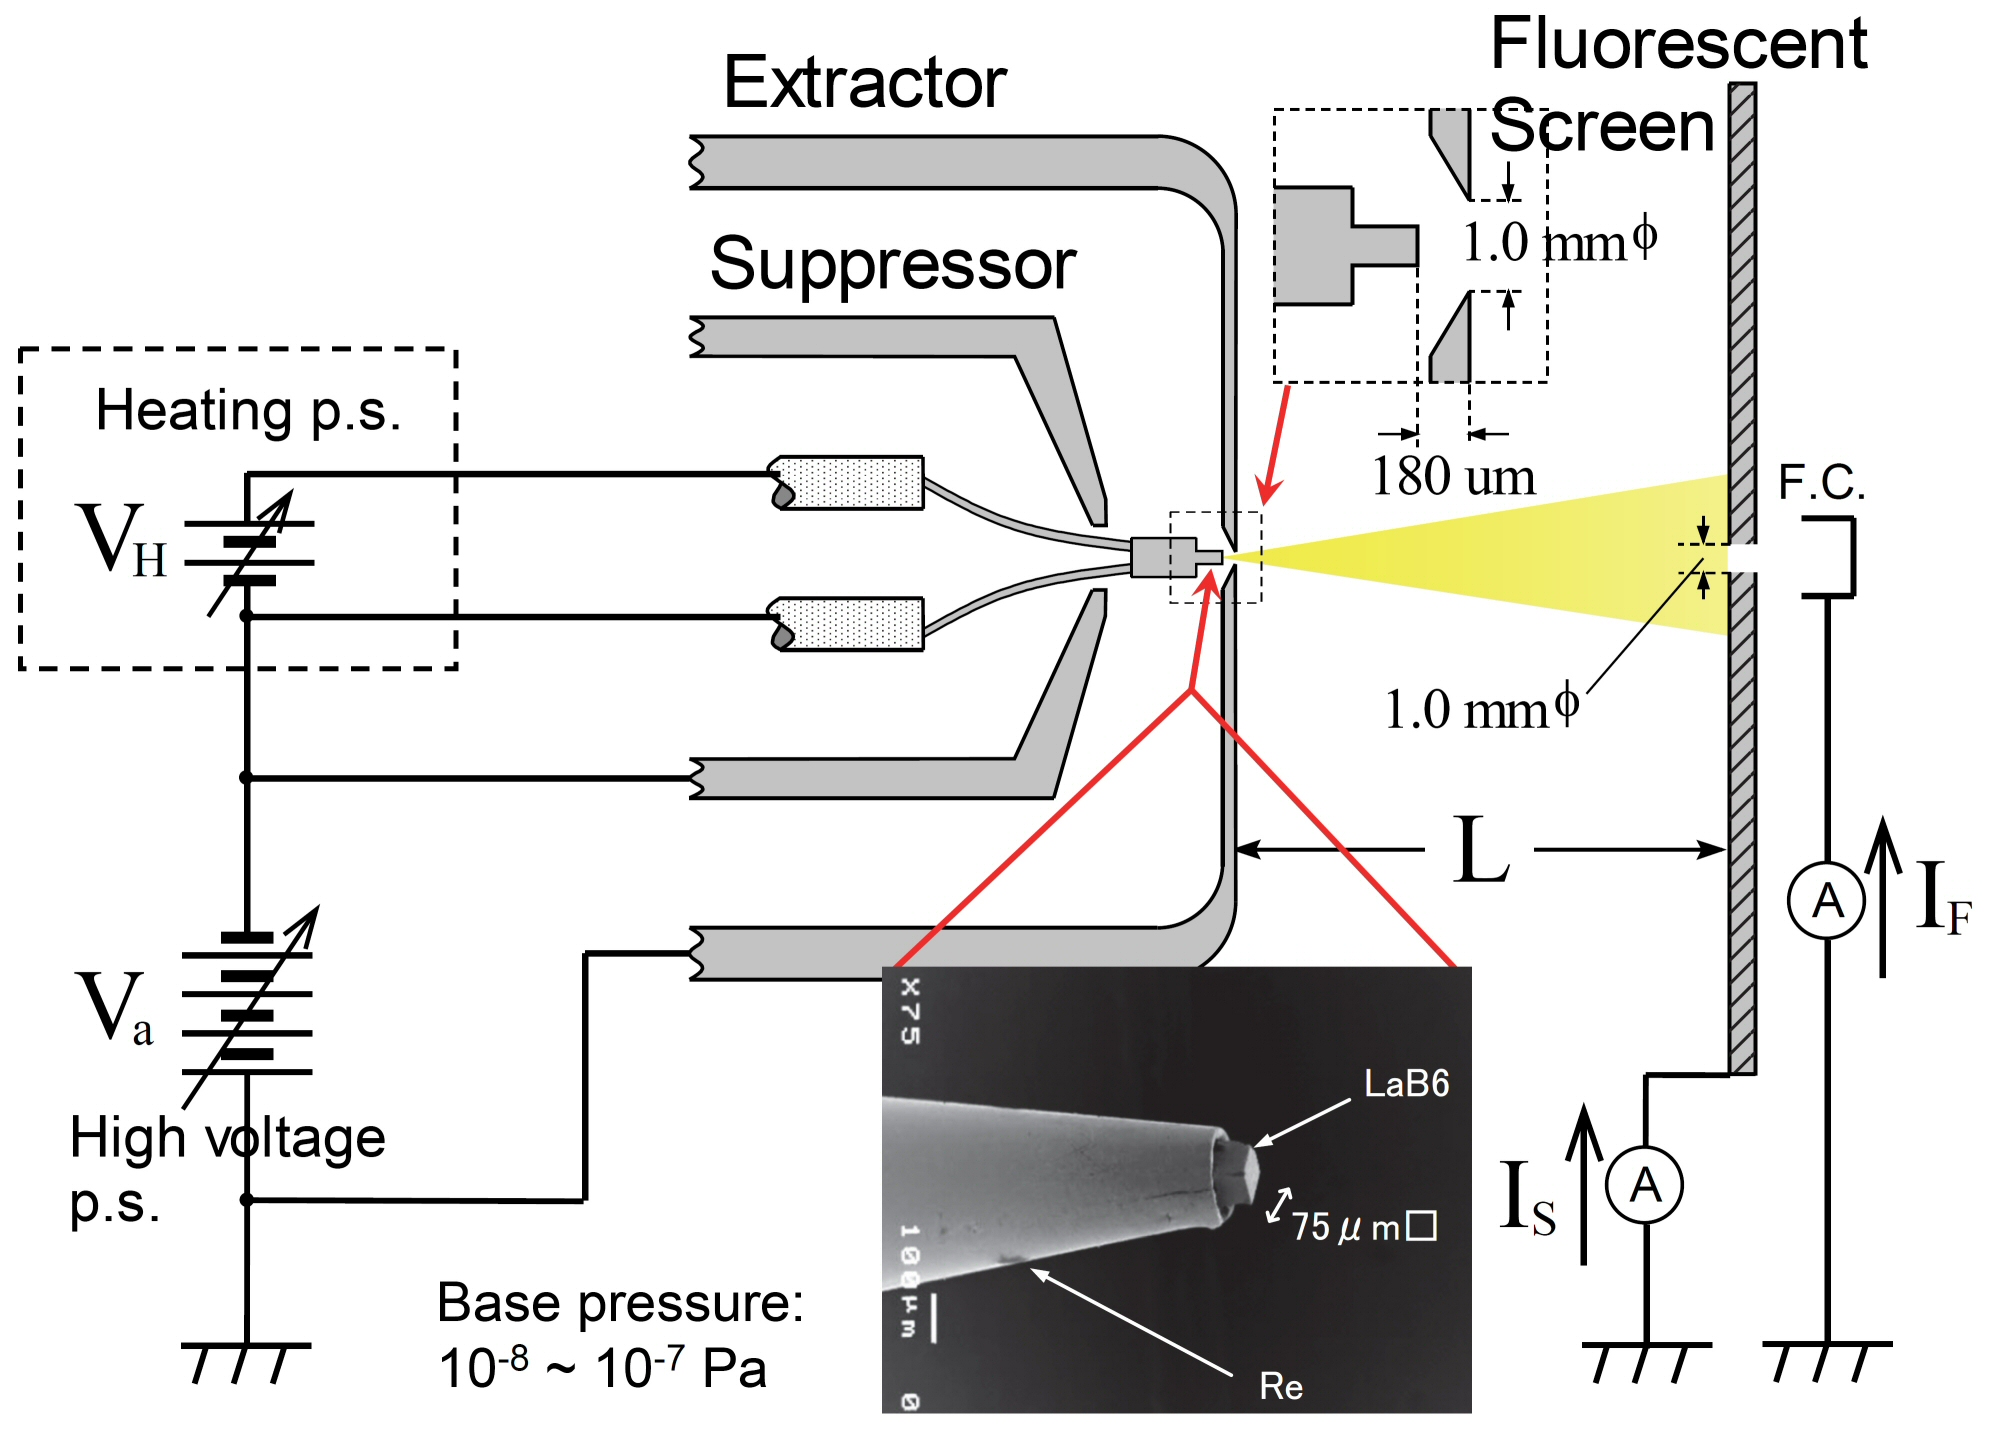
Fig. 1: Experimental circuit for measuring the beam current by Faraday cup. |
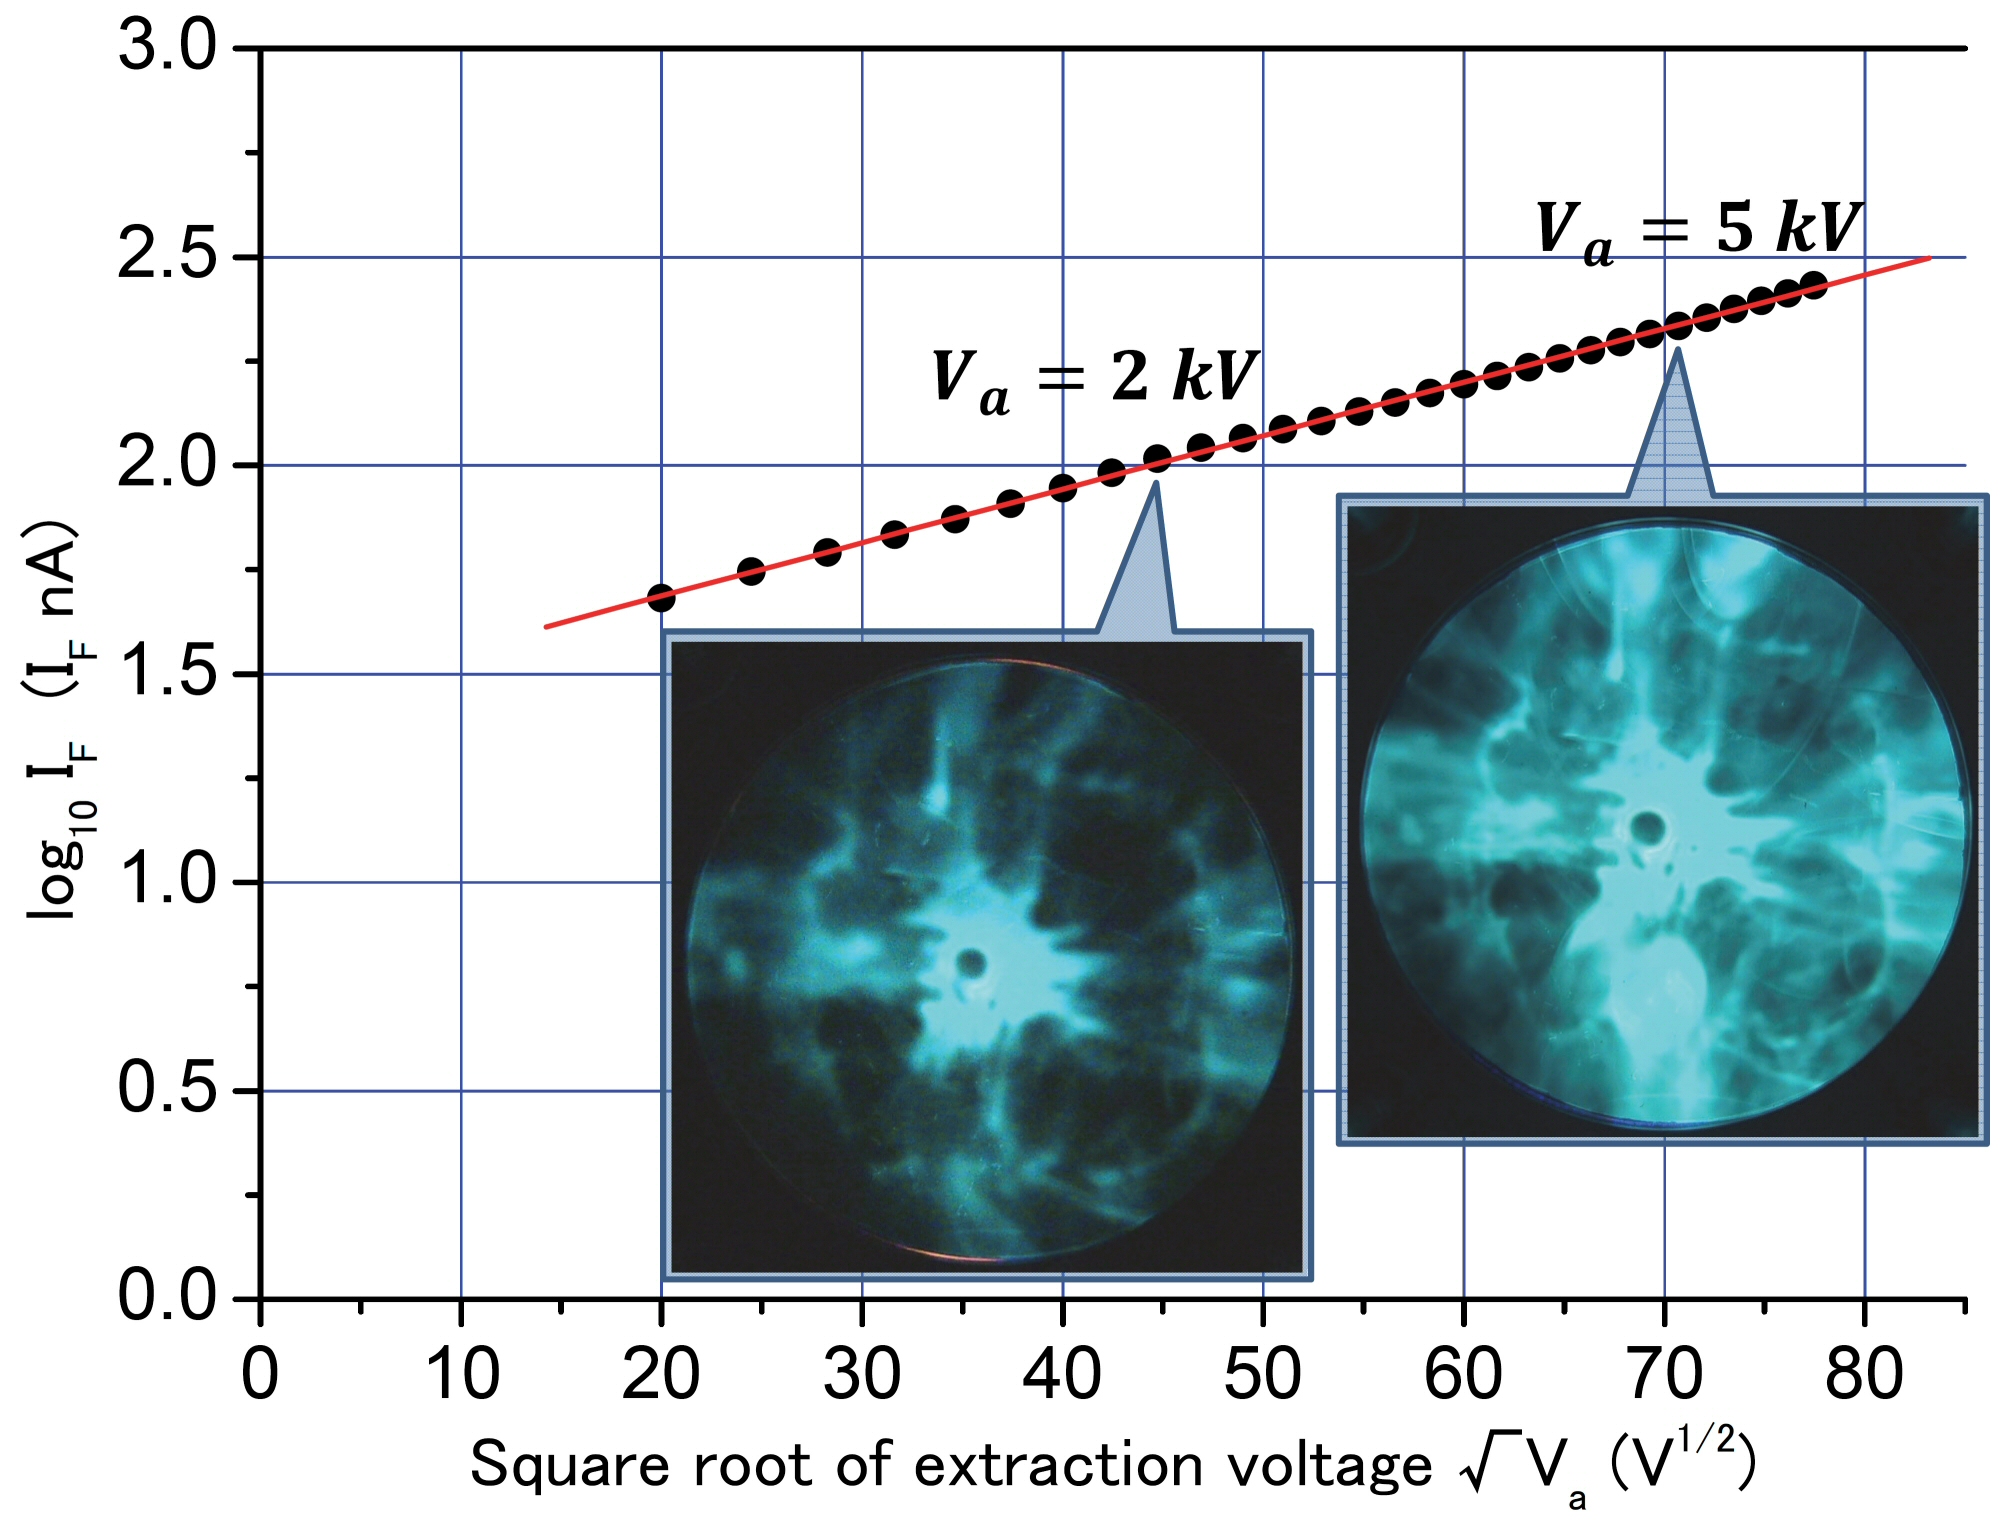
Fig. 2: Experimental Schottky plot for emitter temperature T = 1600 K. Emission patterns observed on the fluorescentscreen at Va = 2 kV (a) and 5 kV (b). |
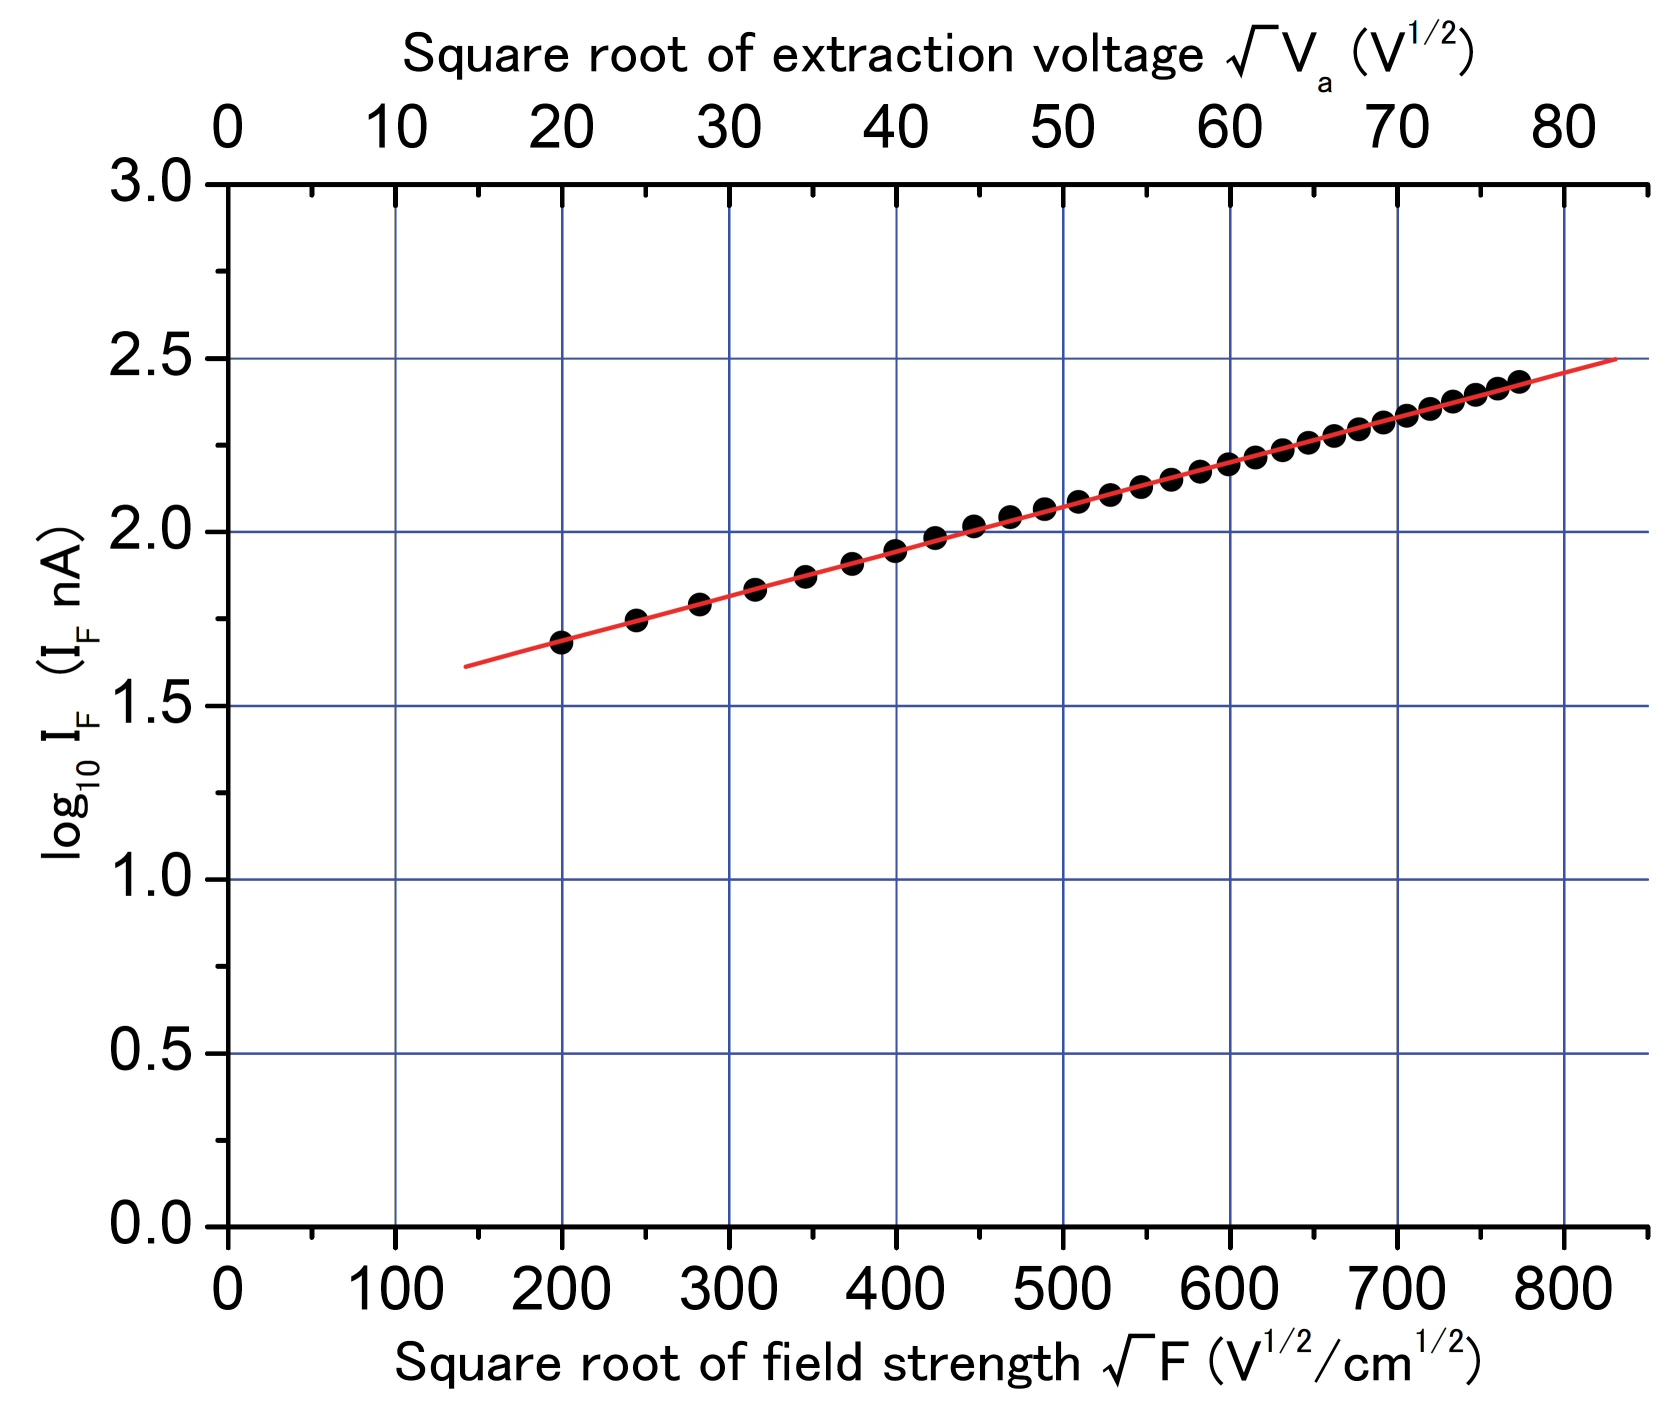
Fig. 3: Schottky plot for T = 1600 K for determination of geometrical formfactor β. A newhorizontal axis scaled in the square root of F is added so that the slope ofthe Schottky plot may be equal to 1.913/T. |
|