IT-5-P-5964 On application of the Multivariate Statistical Analysis in spectrum-imaging
Availability of TEM instruments with fast spectrum-imaging EDX and EELS facilities made it possible to map the composition and structural properties with a high resolution. A typical spectrum-imaging data cube now routinely exceeds the size of 100x100x1000 pixels. The extraction of the chemical/structural information from such huge arrays of data can be significantly improved by using well established techniques of Multivariate Statistical Analysis.
Among the multivariate statistical methods, the most attention is paid to the Principal Component Analysis (PCA) which decomposes the observation set into the set of linearly uncorrelated variables. The components with the highest variance are assumed to have the highest significance and to correlate with the variation of the material parameters such as composition or structure features while the lower-variance components might be associated with the statistical noise and therefore ignored. As PCA is closely related to the eigenvector decomposition in linear algebra, the very efficient algorithms for its implementation are available. However, a caution should be taken when treating a spectrum-image from a system of several objects, for instance, an agglomeration of the particles of different nature. Fig.1 shows the score plot of the PCA components for such a system clearly indicating the separation of the data onto the two distinct clusters. In this situation, the PCA results represent the average eigenvectors for the two unrelated data sets and cannot bear any physical meaning. A more efficient strategy is to segment first the data onto the appropriated clusters and then apply PCA for each cluster individually.
Another approach is the reconstruction of a spectrum-image using a small number of the highest-variance components while cutting off the rest “noise” components [1]. Here PCA is used as a kind of noise filter and the physical meaning of the PCA components is unimportant. The problem appears when the variance of the minor components is comparable or beneath the typical variance due to noise. In this case the useful signal might partially “leak” to the “noise” components and be lost during the subsequent reconstruction [2]. The possible solution is to retrieve a relatively large number of the PCA components and then apply to them the Independent Component Analysis (ICA). Similar to PCA, ICA can be thought of as a rotation in the variable coordinates that maximizes the Curtosis of a given component. This way, the truly independent not just statistically uncorrelated components can be retrieved while the noise can be cut off.
References:
[1] M. Watanabe, E. Okunishi, K. Ishizuka, Microscopy and Analysis 23 (2009) 5-7.
[2] S. Lichtert, J. Verbeeck, Ultramicroscopy, 125 (2013) 35-42.
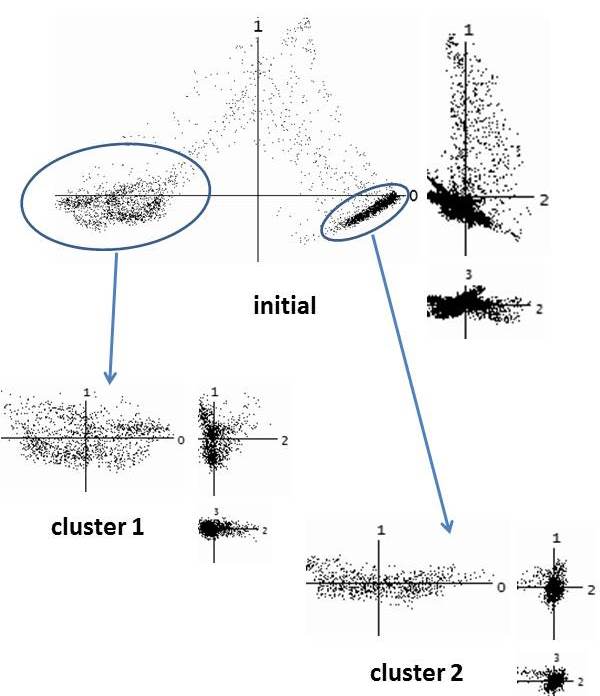
Fig. 1: Scatterplots of the first three PCA components for the system composed of two objects.PCA retrieves the “average” eigenvectors that cannot unmask the nature of theobjects. The fragmentation of the data and the application of PCA to eachcluster individually make the maximal variance in each object coinciding withthe direction of the eigenvectors. |