IT-5-P-5918 Identifying suboxide grains at the metal-oxide interface of a corroded Zr-1.0Nb alloy using (S)TEM, transmission-EBSD and EELS
Here we report a methodology combining Transmission Electron Microscopy (TEM), Scanning Transmission Electron Microscopy (STEM), Transmission-EBSD (t-EBSD) and Electron Energy Loss Spectroscopy (EELS) to analyse the structural and chemical properties of the metal-oxide interface of corroded Zr-1.0Nb alloys in unprecedented detail. The sample which has been under autoclave condition for 360 days shows no sign of transition, suggesting its excellent corrosion resistance1. TEM and STEM results reveal the complexity of the distribution of suboxide grains at the metal-oxide interface. Convergent beam electron diffraction (CBED) patterns were acquired from a region close to the metal/oxide interface which matches with the [3 2 -4] zone axis of the hexagonal ZrO phase with P-62m symmetry and lattice parameters a=5.31 Å and c=3.20 Å predicted by Nicholls et al2. EELS provided accurate quantitative analysis of the oxygen concentration across the interface, identifying the existence of local regions of stoichiometric ZrO and Zr3O2, with significant local variations in thicknesses from 20 nm to 326nm, much thicker than observed previously in other oxidised zirconium alloys3. T-EBSD confirmed that the suboxide grains can be indexed with the hexagonal ZrO structure. The t-EBSD analysis has also allowed us to map a relatively large region (~7μm) of the metal-oxide interface, revealing the location and size distribution of the suboxide grains. These observations will be compared to previous reports of less corrosion-resistant alloys studied by the same techniques.
1. Wei, J. et al. Autoclave study of zirconium alloys with and without hydride rim. Corros. Eng. Sci. Technol. 47, 516–528 (2012).
2. RJ Nicholls, N Ni, S Lozano-Perez, A London, DW McComb, PD Nellist, CRM Grovenor, CJ Pickard, J. Y. Crystal structure of the ZrO phase at zirconium / zirconium oxide interfaces. Adv. Eng. Mater.Accepted
3. Ni, N. et al. How the crystallography and nanoscale chemistry of the metal/oxide interface develops during the aqueous oxidation of zirconium cladding alloys. Acta Mater. 60, 7132–7149 (2012).
This research was funded by the MUZIC2 consortium and JH is supported by the China Scholarship Council.
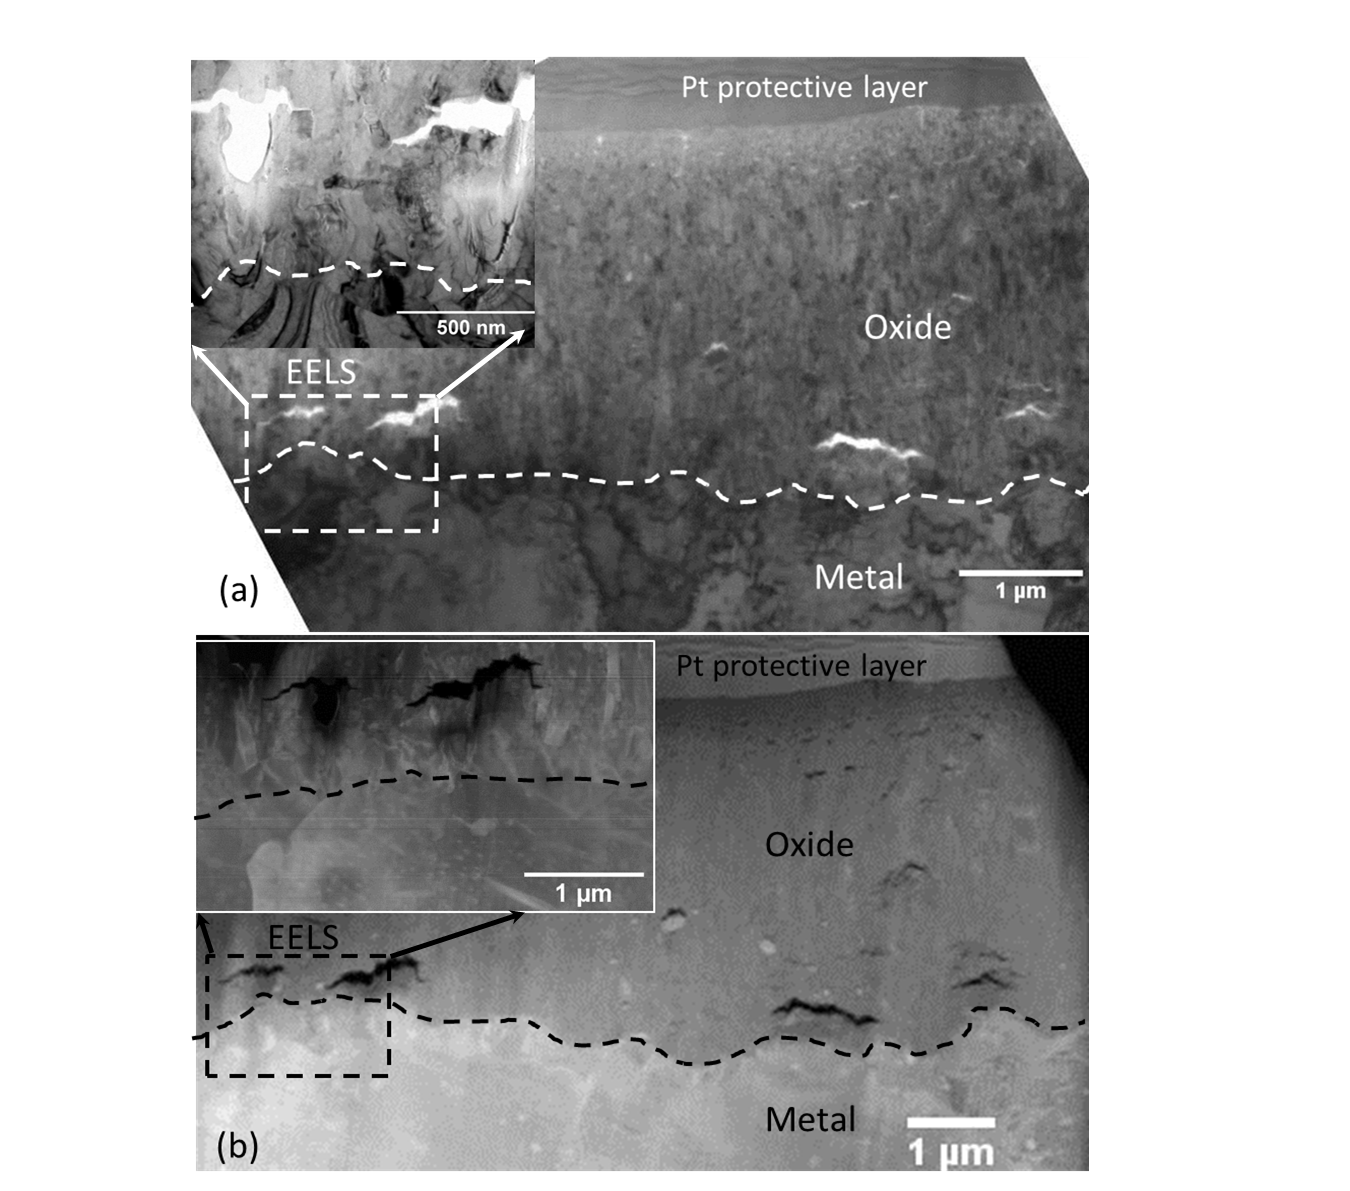
Fig. 1: (a): Bright field image of the TEM sample. Figure 1(b): HAADF-STEM image of the TEM sample. The area used for EELS analysis is highlighted. The inset shows higher magnification images of this same area after further FIB thinning (which has created the hole under the left hand crack) |
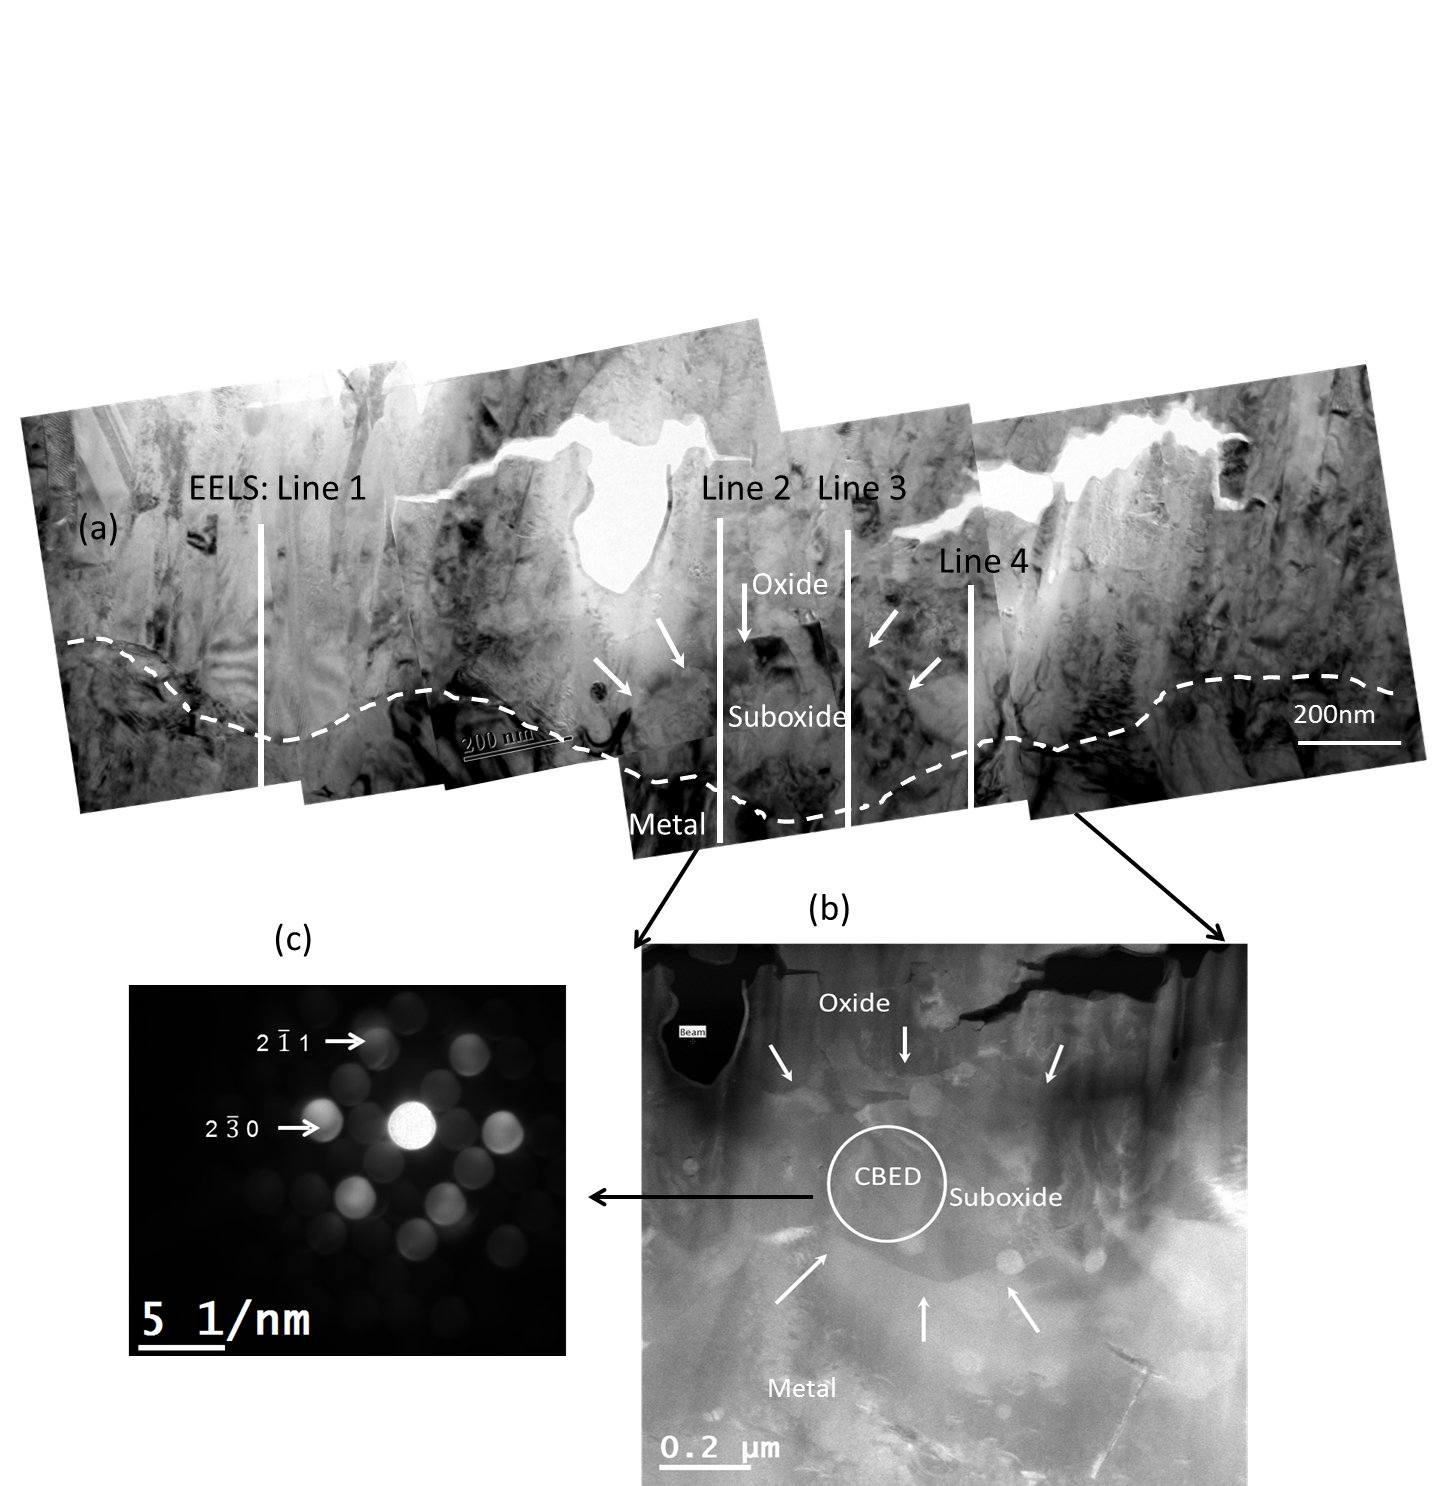
Fig. 2: (a) High magnification bright field image the metal-oxide interface chosen for EELS analysis. The suboxide grain which was diffracting is highlighted using arrows. (b) STEM dark field image of the suboxide grain area, the area where CBED pattern was taken is highlighted. (c) CBED pattern of the suboxide grain which matched with hexagonal ZrO phase. |
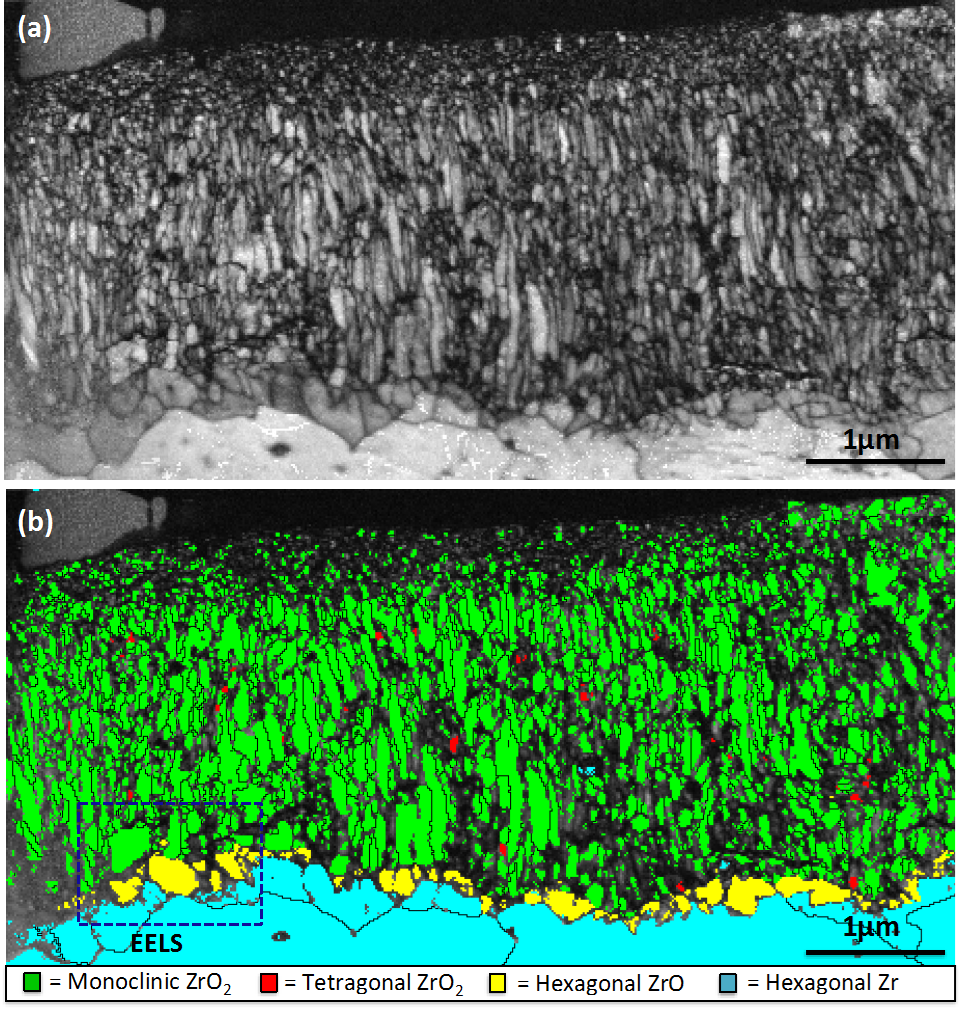
Fig. 3: (a) Band contrast map, (b) Phase map from t-EBSD analysis of the TEM sample. The yellow part near the metal-oxide interface is matched with hexagonal ZrO phase with P-62m symmetry and lattice parameters a=5.31 Å and c=3.20 Å2. The area for the EELS and CBED analysis is also highlighted. |
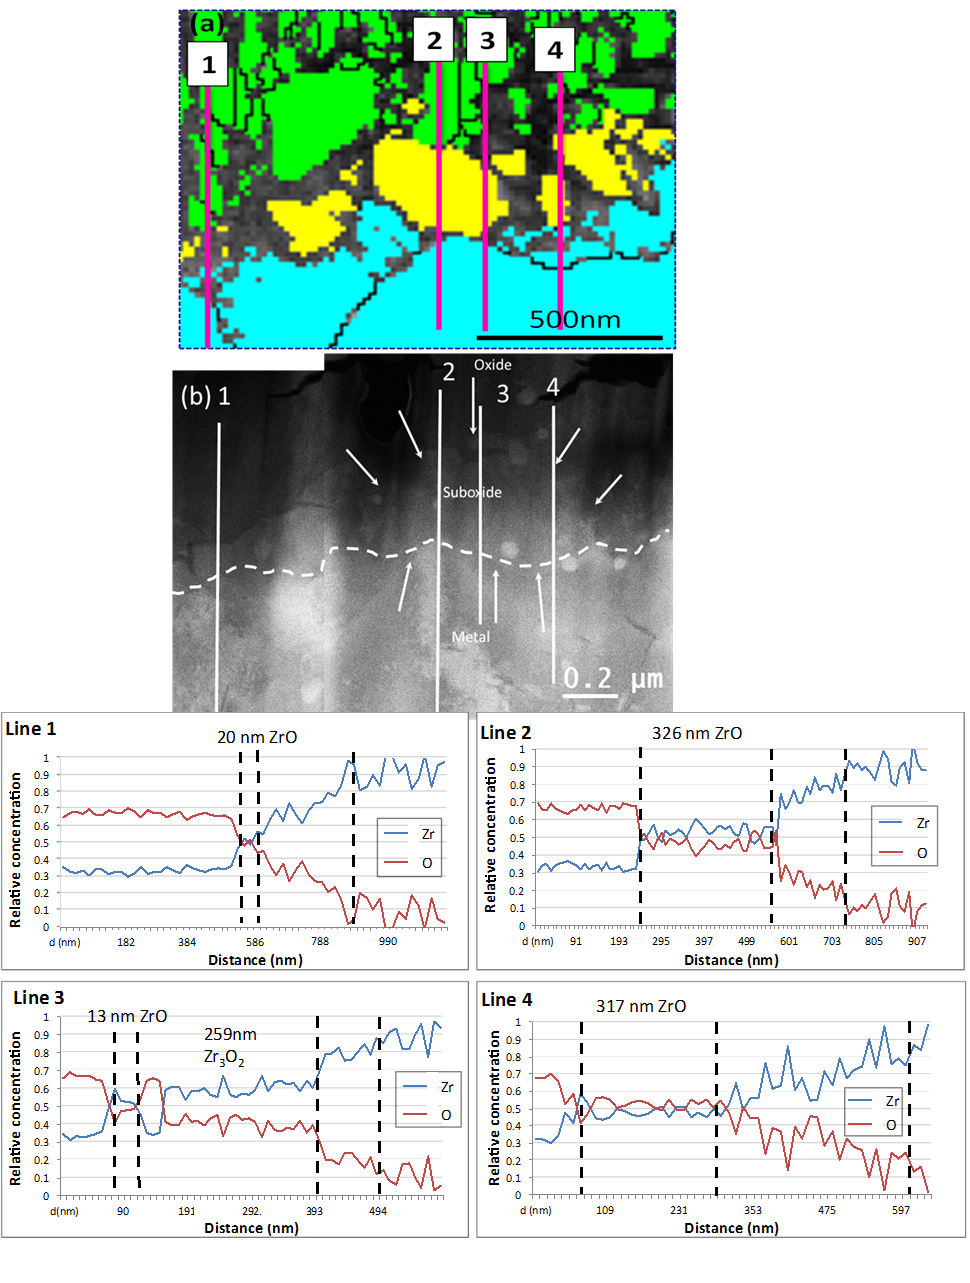
Fig. 4: Positions of EELS line scans from the suboxide region relative to (a) the t-EBSD map. (b) the HADDF image. Lines started from the oxide towards metal. (c) Zirconium and oxygen concentration of the EELS line scan showing both stoichiometric ZrO and Zr3O2, with significant local variations in thicknesses from 20 nm to 326nm. |