IT-5-P-5813 Spectrum-based phase mapping of apatite and zoned monazite grains using principal component analysis
EDS X-ray mapping requires trade-offs between interaction volume, collecting enough above-background counts, selecting appropriate elements, and avoiding sample damage. These trade-offs may produce confusing results, especially in samples containing multiple phases with similar compositions. Applying contrast enhancements and filters to X-ray maps fails to eliminate the confusion of interfering X-ray lines and phases with similar compositions. However, acquiring an image cube with an EDS spectrum at every pixel and comparing the mapped spectra using principal component analysis (PCA), phases can be readily distinguished.
A rock sample containing accessory monazite ([La,Ce,Pr,Nd,Th]PO4) was polished, carbon coated, and examined in an FESEM. EDS spectral imaging was done at 5 and 15 kV. Phases were identified using COMPASSTM spectral phase mapping, which identifies phases based on PCA of the EDS spectrum at each pixel [1,2].
In Figs. 1 and 2, an apatite (Ca5[PO4]3[F,Cl,OH]) grain is partially included in a monazite grain. In 15 kV BSE imaging (Fig. 1a), transmission through thin phases (e.g., “Silica;” Fig. 1a) is evident. 5 kV imaging (Fig. 2a) produces images and X-ray maps more representative of the sample surface. In the 5 kV O and P Kα maps (e.g., Fig. 2c), apatite and monazite are indistinguishable (2.5 hour acquisition). If this sample was mapped without a light REE in the setup, monazite could be misidentified as apatite. However, after 7.5 minutes of acquisition time, COMPASS distinguishes the phases (Fig. 2c). Additionally, spectral imaging of the monazite grain in Fig. 1b (15 kV) reveals a partial rim, < 1 μm wide, that contains higher Th. PCA is able to distinguish the Th-rich rim at 5 kV as well (Fig. 2b).
PCA is an important tool for clarifying confusing X-ray maps. Using spectral imaging with PCA can provide higher confidence identification of phases in less time than traditional elemental mapping.
References
[1] Keenan et al., Method of Multivariate Spectral Analysis. Patent 6,675,106 B1. 06 Jan. 2004.
[2] Keenan et al., Apparatus and System for Multivariate Spectral Analysis. Patent 6,675,106 B1. 06 Jan. 2004.
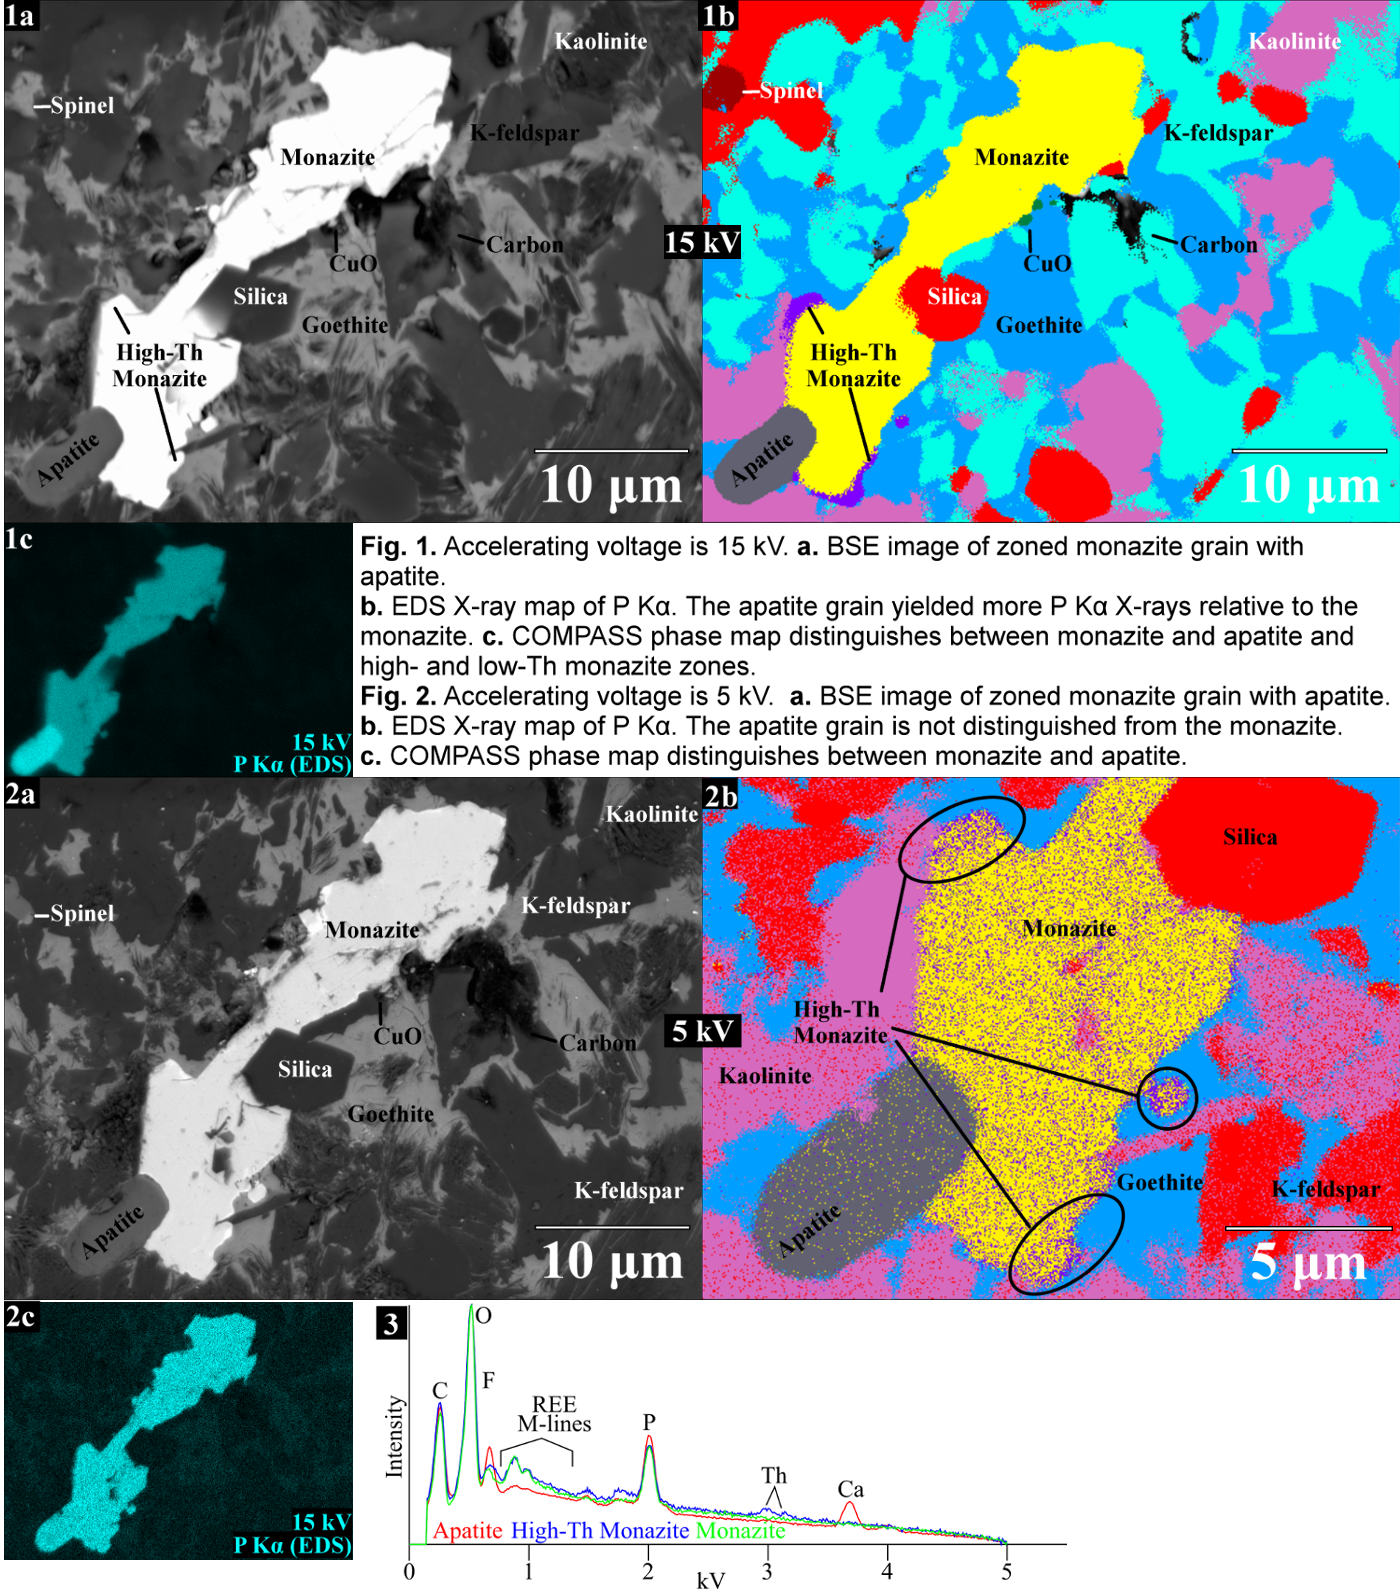
Fig. 1: Fig. 3. EDS spectra from apatite (red), high-Th monazite (blue), and monazite (green). The vertical axis is a square root scale. |