IT-6-P-5803 ETEM observation of degradation of platinum and platinum-cobalt alloy nanoparticle electrocatalysts on carbon black
The Proton Exchange Fuel Cell (PEFC) is expected as a promising energy source to use of Fuel Cell Vehicle. Platinum nanoparticles on carbon black (Pt/C) are a typical electrode catalyst used in the PEFC. For development of advanced electrode catalysts in the PEFC, reducing Pt usage and enhancement of the durability are still problems. In order to reduce the Pt usage, Pt-metal alloys were investigated in recent few years and previous researches have reported that Pt-Co alloy represented the high Oxygen Reduction Reaction (ORR) activity and improved stability on cathode condition of PEFC. For further design concept of the Pt-Co electrode catalysts, it can be essential to understand the degradation mechanism in real space about both Pt and Pt-Co alloy. Because actual Pt-Co catalysts consist of pure Pt nanoparticle, Co nanoparticle, the ordered Pt-Co alloy (L12 etc.) and disordered Pt-Co alloys. In this report, we evaluated structural changes of the Pt/C and the PtCo/C electrode catalysts during electrochemical degradation by using Environmental Transmission Electron Microscopy (ETEM). In addition to such ex-situ approach, we achieved the dynamic in-situ observation in controlled water (H2O) atmosphere which is known as product molecule of ORR in PEFC.
For electrochemical degradation tests simulating the start and stop test of PEFC, potentio/galvanostat was used with a potential range from +1.00 V to +1.50 V, a scan rate of 500 mVs-1 in 0.1 M HClO4 at room temperature for 40,000 cycles. In our degradation tests, Electrochemical Surface Area (ECSA) of Pt/C decreased 57% and PtCo/C decreased 27% through 40,000 cycles (Fig. 1(e, f)). The size of nanoparticle and the surface area of nanoparticles were clearly increased in ex-situ TEM images obtained from both Pt/C and PtCo/C (Fig. 1(a-d), Fig. 2(a)). It indicated that Pt and PtCo nanoparticles grow and carbon black particles shrink during the electrochemical degradation test.
Then, we achieved a dynamic observation to investigate the cause of the coalescence of Pt nanoparticles. In 10 Pa of water vapor (H2O), Pt nanoparticles rapidly diffused on the carbon surface and formed an interconnected structure (Fig. 2(b-e)). We considered that physical adsorption of H2O molecule and hydroxylation of the dangling bond on carbon surface were the main causes of the rapid mobility of Pt nanoparticles. Therefore, we consider that much stronger trapping sites on the carbon is needed to reduce the mobility of Pt and Pt-Co nanoparticles.
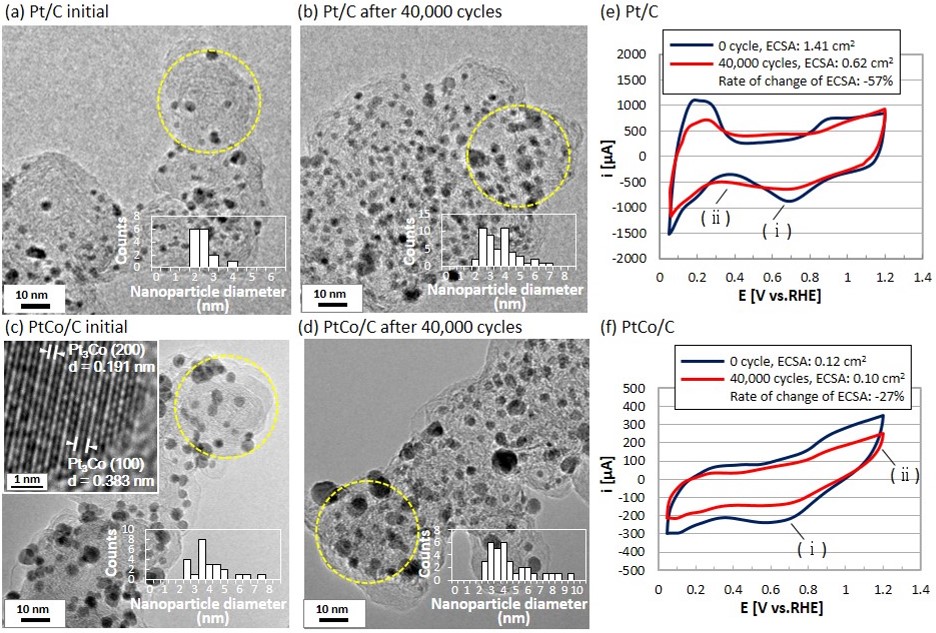
Fig. 1: (a-d), Ex-situ TEM images of Pt/C and PtCo/C before and after degradation. Size distribution of nanoparticles as an inset. (e, f), CV curves of Pt/C and PtCo/C obtained before and after degradation test over a potential range from +0.05 V to +1.20 V at a scan rate of 500 mVs-1 in 0.1 M HClO4 at room temperature. |
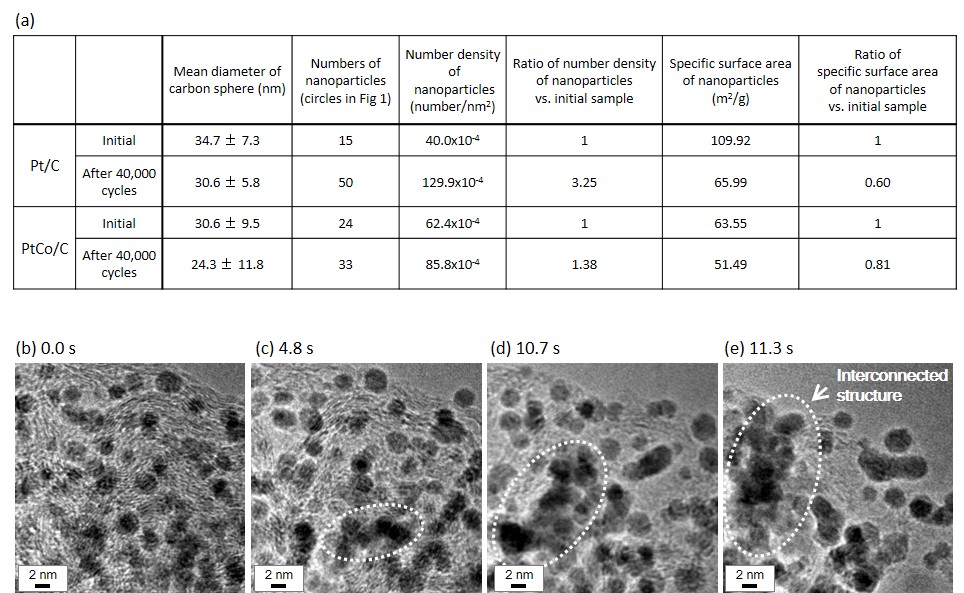
Fig. 2: (a), Specific surface area of Pt and PtCo nanoparticles before and after degradation. It was calculated by presuming that volume of a carbon black particle is volume of a sphere with a diameter of 35 nm (the circles in Fig. 1(a-d)). (b-e), Selected area captured images of a movie obtained from Pt/C in 10 Pa of water atmosphere. |
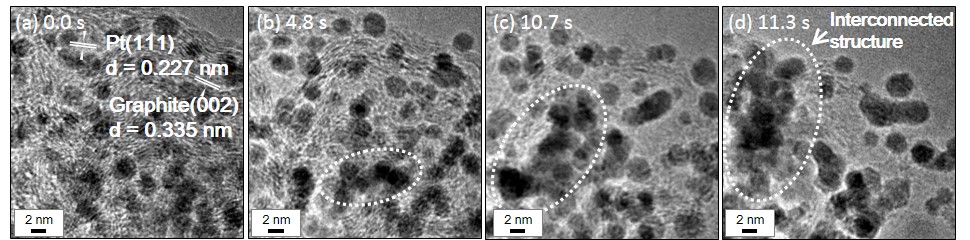
Fig. 3:
|
|