IT-2-P-5735 Quantitative measurement of electron magnetic circular dichroism on polycrystalline iron film
Electron magnetic circular dichroism (EMCD) is a measurement technique, which allows to measure element-specific spin and orbital magnetic moments using a transmission electron microscope. Since its discovery in 2006 [1] it went through a rapid development, bringing improvements in spatial resolution and signal strength. Yet, quantitative measurements remained difficult using the classical approach because of the low signal to noise ratio (SNR). The classical approach suggested to orient the sample into a 2-beam or 3-beam orientation and acquire core-level spectra (ELNES) at two distinct positions in between Bragg spots (so called Thales circle positions). Here we describe a different approach that overcomes these limitations and can be applied on a polycrystalline sample without setting any particular orientation [2]. We use a polycrystalline iron sample, Fig. 1, and acquire few hundreds of Fe L2,3 ELNES spectra, while scanning with the beam over the sample using a megaelectronvolt Jeol JEM-1000 K RS microscope. The scanning step is set to a value close to an average size of a crystalline grain in the sample, therefore it is very likely that every spectrum is taken from a different grain and thus at a different crystal orientation. The detector orientation is shifted by approximately G(110)/2 from the transmitted beam direction. In the next step the dataset is statistically processed and an averaged EMCD signal is accumulated, Fig. 2. The reliability of the method was checked on a NiO control sample, which shows no net magnetization. Finally, EMCD sum rules [3] have been applied to extract the ratio of the orbital to spin moment, Fig. 3. The obtained value 0.0429 +/- 0.0075 is in close agreement with x-ray magnetic circular dichroism measurements [4].
[1] P. Schattschneider, S. Rubino, C. Hebert, J. Rusz, J. Kunes, P. Novak, E. Carlino, M. Fabrizioli, G. Panaccione and G. Rossi, Nature 441, 486 (2006).
[2] S. Muto, J. Rusz, K. Tatsumi, R. Adam, S. Arai, V. Kocevski, P. M. Oppeneer, D. E. Burgler, and C. M. Schneider, Nature Comm. 5, 3138 (2014).
[3] J. Rusz, O. Eriksson, P. Novak, P. M. Oppeneer, Phys. Rev. B 76, 060408(R) (2007).
[4] C. T. Chen et al., Phys. Rev. Lett. 75, 152 (1995).
A portion of this work was supported by a Grant-in-Aid on Innovative Areas "Nano Informatics" (grant number 25106004) and on Young scientist A (24686070) from the Japan Society of the Promotion of Science. J.R. and P.M.O. acknowledge the support from the Swedish Research Council, J.R. acknowledges support from STINT and P.M.O. from the European Commission (grant No. 281043).
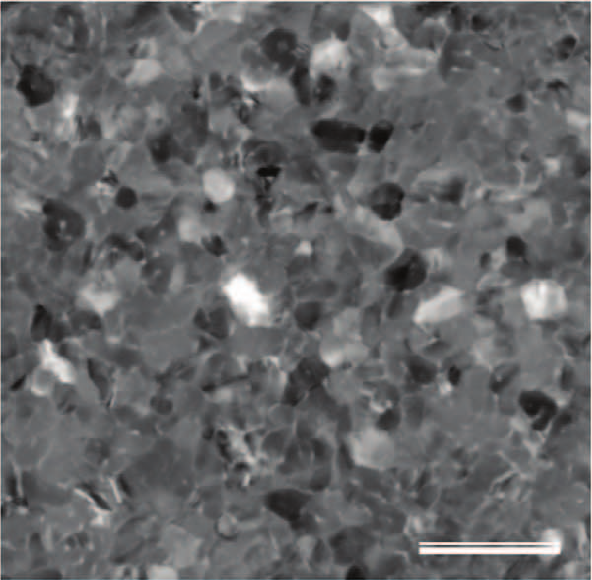
Fig. 1: TEM image of the polycrystalline iron sample. Scale bar corresponds to 50nm. |
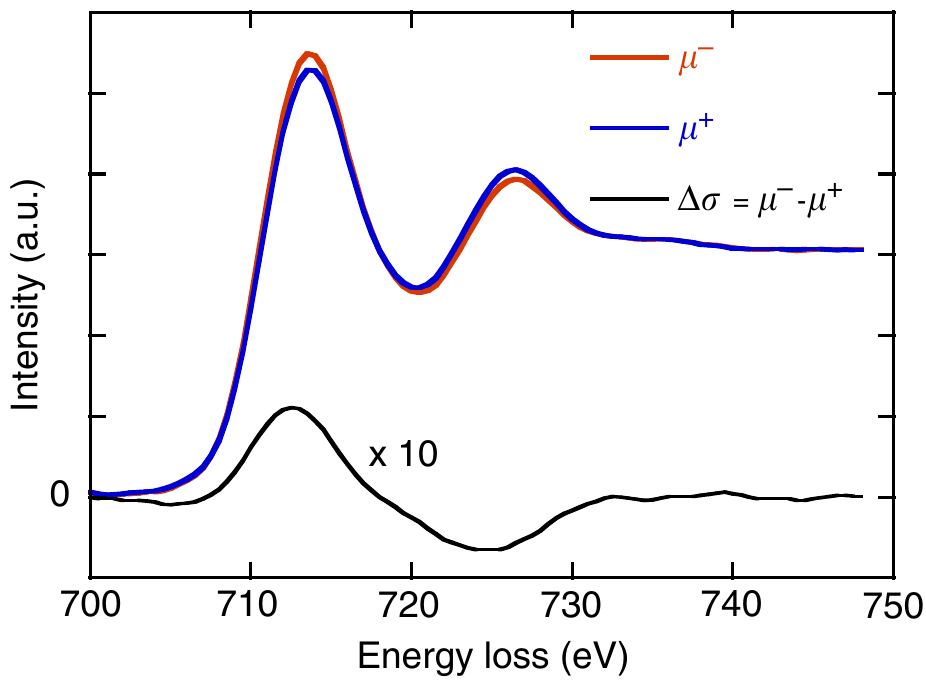
Fig. 2: Accumulated ELNES (blue and red curves) and EMCD (black line) spectra from the entire dataset of 225 individual ELNES spectra. |
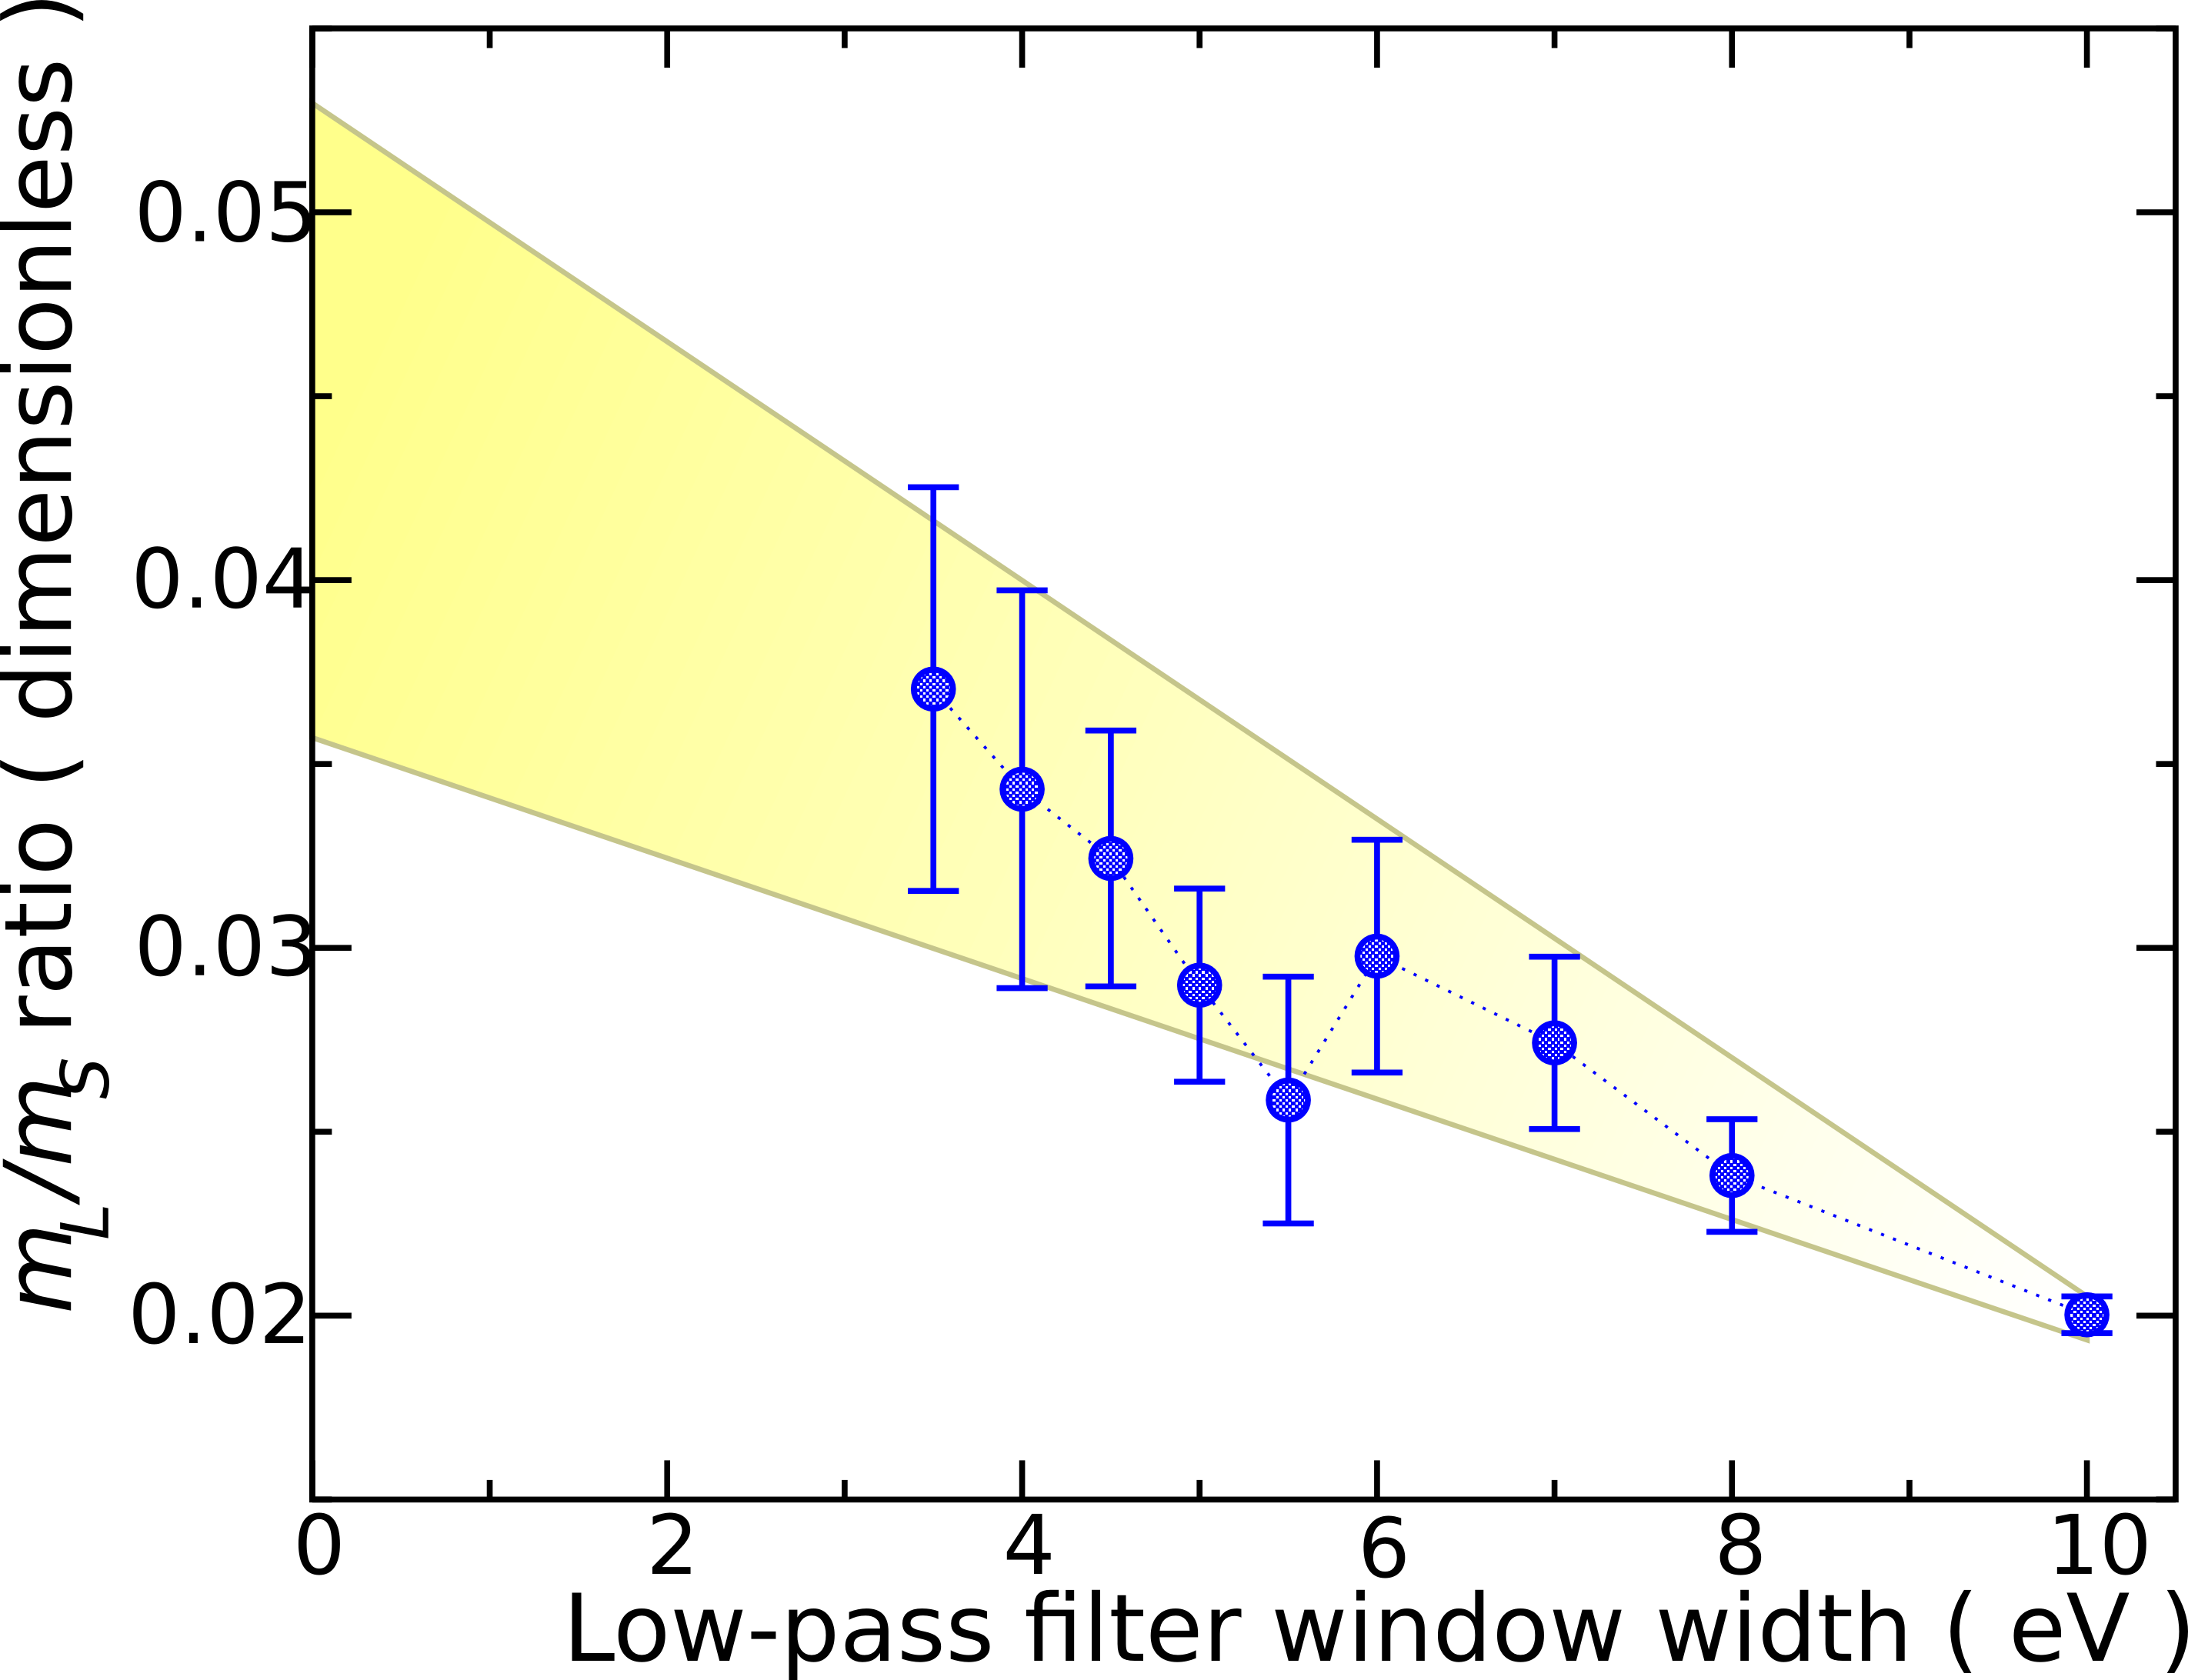
Fig. 3: Extrapolation of the ml/ms ratio as a function of the low-pass filter width. Low-pass filter was applied to individual ELNES spectra prior to statistical extraction of the EMCD spectrum. WIthout low-pass filter the statistical extraction was numerically unstable. |
|