IT-5-P-3430 The “equivalent sphere” approach to fitting surface plasmon energy loss spectra
With the advent of modern cold field emission guns and commercial monochromators on Schottky sources, the remarkably high energy resolution available in the low loss part of the electron energy loss spectrum (EELS) has enabled detailed characterisation of low energy excitations such as localised surface plasmon resonances (LSPRs) in metallic nanoparticles [1]. Analysis of the LSPRs has conventionally involved fitting characteristic peak shapes using a series of Gaussian or Lorentzian functions. Whilst this has proved to be successful in some cases, inherently the LSPR peaks are asymmetric, most evidently with larger retardation effects, and the number and energy of each Gaussian/Lorentzian is not always easy to determine.
Here we propose a new approach to fit the LSPRs based on the line shapes of plasmon modes excited by an electron passing close to a metal sphere. EELS for some impact parameter and sphere radius can be calculated analytically using a linear sum of basis functions and associated coefficients [2]. Allowing the line-shape to scale in amplitude and shift in energy axis enables fitting such functions to simulated or experimental data.
As an example, we consider fitting EELS of a silver nanocube (with rounded corners and edges) in vacuo. Fig 1 is an e-DDA [3] simulated loss spectrum from a cube with 10 nm edge. The spectrum has been fitted using three separate line-shapes, each calculated from Mie theory for LSPRs. For spheres of this size, the dipolar mode is dominant. Fig 2 shows an equivalent spectrum to Fig 1, but for a silver cube of 100 nm size. The spectrum again has been fitted using this method, but with different radii for the three spheres. Fig 3 shows how the “equivalent sphere” diameter changes with cube size for the lowest order (dipolar) excitations. The smaller (10nm) cube can be fitted using the usual collection of Lorentzians, but it does not work well with the 100nm cube due to asymmetric peaks.
Work is ongoing to apply this approach in analysing experimental data and determine the limitations of it in terms of nanoparticle size and geometry. Whilst empirically the fits are very promising, we continue to work on the underlying basis for why the spectra can be described in terms of a series of spectra from “equivalent spheres” but note that, for example, in the case of cubes, cubic harmonic functions describing the lattice harmonics of a cubic crystal can be written in terms of spherical harmonics [4].
[1] J. Nelayah et al., Nat. Phys. 3, 348 (2007).
[2] F. J. Garcia de Abajo, Phys. Rev. B 59, (1999).
[3] N. W. Bigelow et al., ACS Nano 6, 7497 (2012).
[4] S. Altmann and A. Cracknell, Rev. Mod. Phys. 37, 19 (1965).
We acknowledge the support received from the European Union Seventh Framework Program under Grant Agreement 312483 – ESTEEM2 (Integrated Infrastructure Initiative – I3) and under Grant Agreement 291522-3DIMAGE. FDP and CD acknowledge funding from the ERC under grant number 259619 PHOTO EM
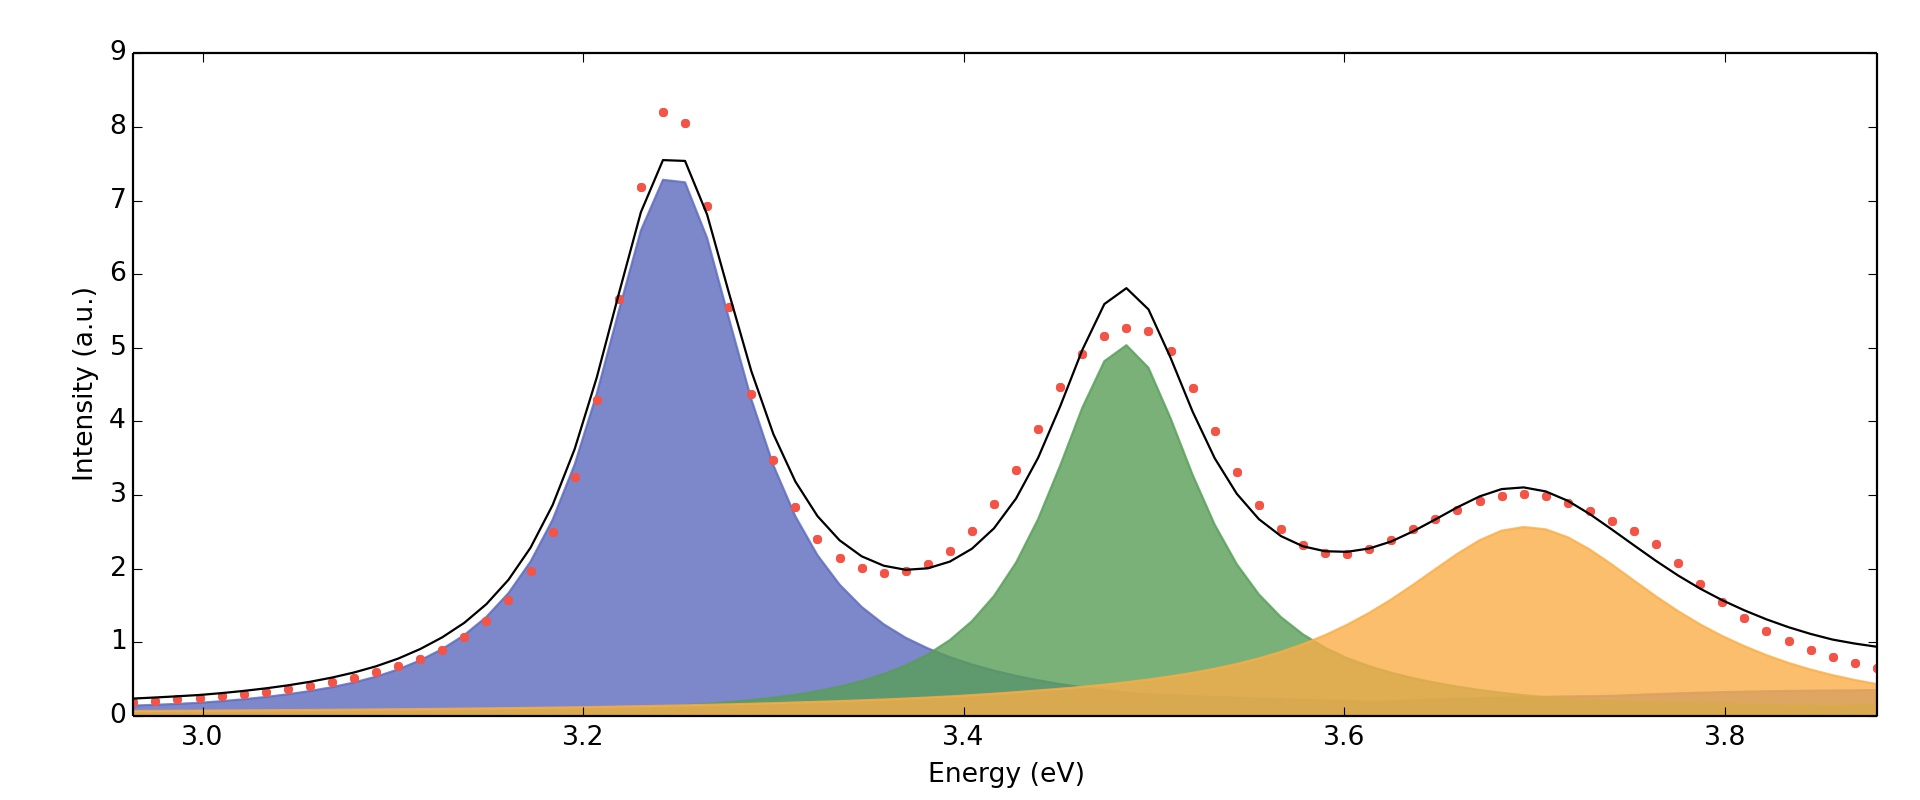
Fig. 1: Fitted EELS spectrum of 10nm silver cube with the electron crossing between opposite midpoints of edges 6 nm above the surface with a beam energy of 300 keV. Components from separate “effective spheres” have been highlighted. |
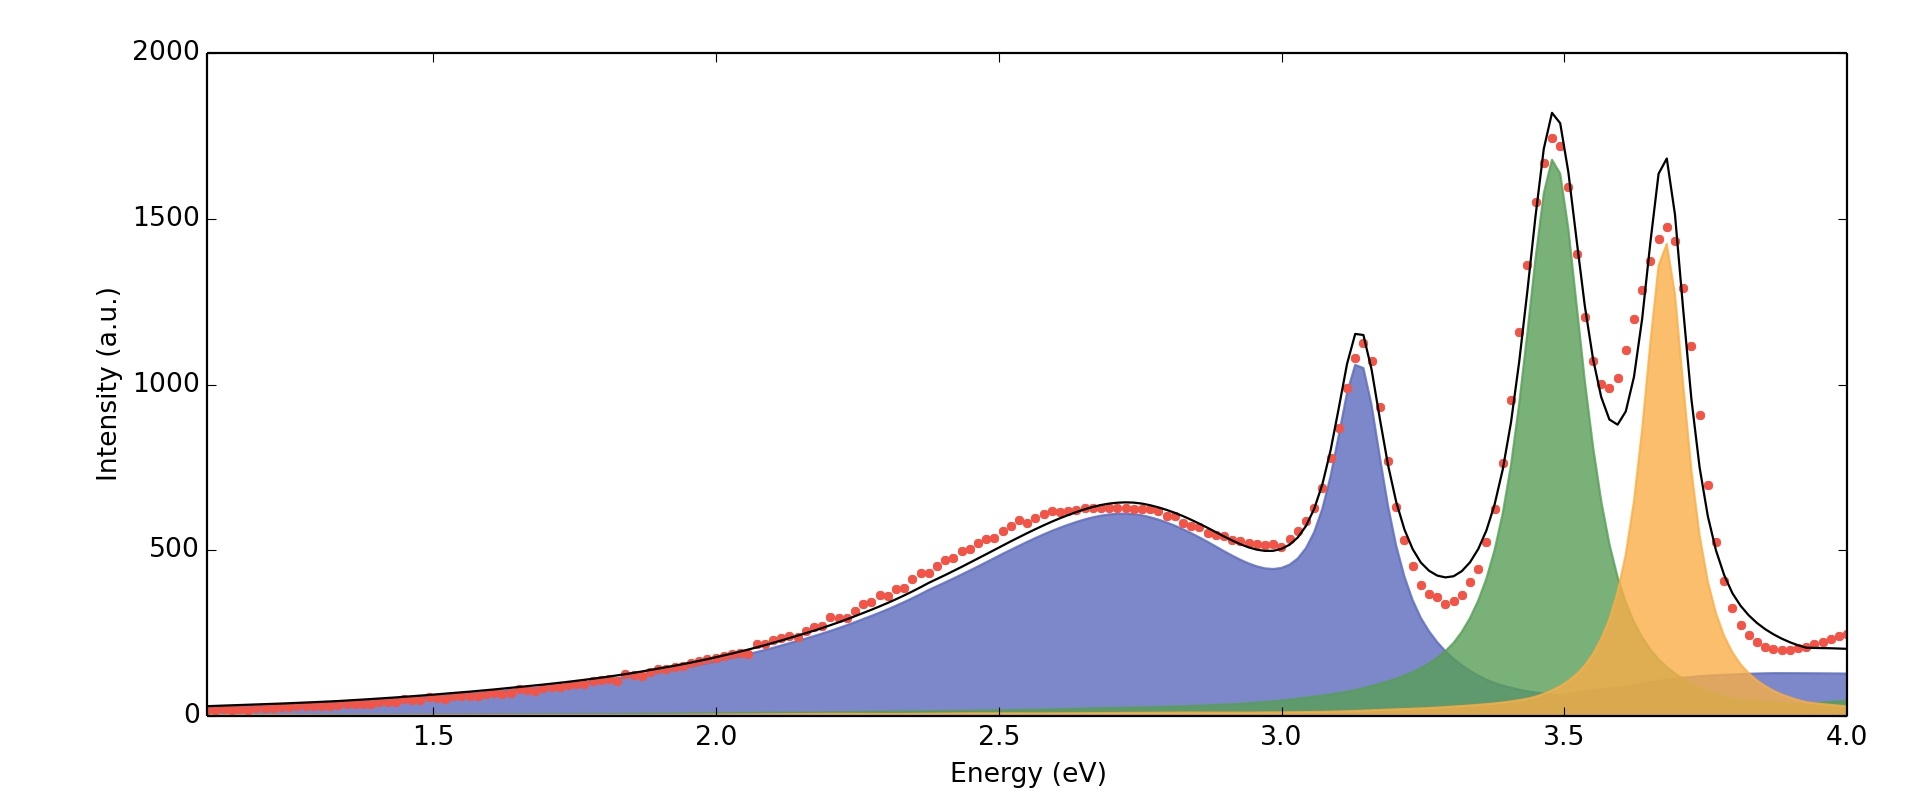
Fig. 2: Fitted EELS spectrum of 100nm silver cube (same trajectory and beam energy as Fig 1). Components from separate “effective spheres” have been highlighted. Particle is big enough to see retardation effects: lowest energy component can only be approximated with at least two spherical modes and is now asymmetric. |
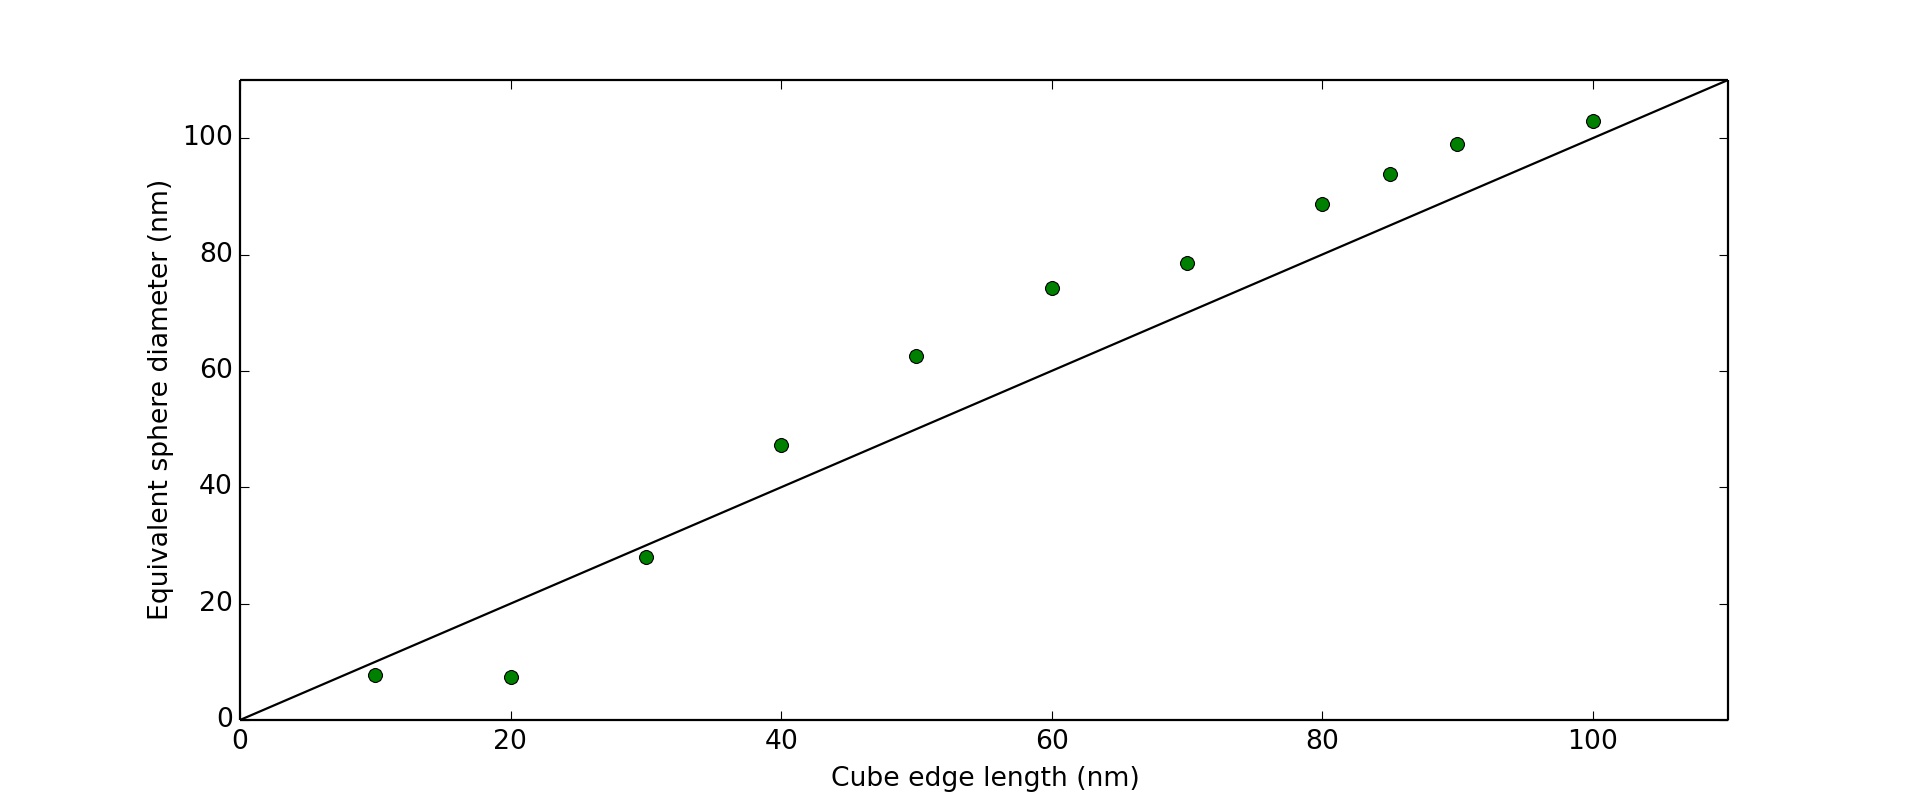
Fig. 3: Diameter of “effective sphere” for lowest energy component versus the simulated rounded cube edge length. A straight line with gradient 1 and no offset is plotted to guide the eye. |
|