IT-9-P-3362 EBSD and EDS Characterisation of Vanadium rich β Phase Lamella in Advanced Titanium Alloys
EBSD has been the focus of significant interest in recent years, driven by advances in detector technology, computational power and indexing routines. The high spatial resolution of EBSD enables structural characterization of materials on the nanoscale, giving instant quantitative information such as orientation, phase and texture. This work discusses developments in EBSD and EDS for the characterisation of submicron grains within advanced titanium alloys, which have important applications in the aerospace sector. High resolution EBSD patterns are used to characterise the propagation of BCC lamella through HCP subgrains, within a larger HCP matrix. Such a system becomes an ideal tool to characterise the structural properties of advanced materials, where the size and orientation of the lamella are related to the formation processes.
EBSD structural information is cross-correlated with chemical information obtained simultaneously through energy dispersive x-ray spectroscopy (EDS), tracking the migration of trace transition elements towards grain boundaries. The detection of these additives presents a challenge for EDS analysis, due to severe overlaps and low concentrations. These are overcome through intelligent peak deconvolution routines and image filtering, with proprietary principal component phase analysis algorithms used to determine chemically unique phases at overall concentrations below 1%.
Ti alloys can exist in three phases, α, α + β and β. At lower temperatures, pure Ti is stable as a close-packed hexagonal crystal structure and at high temperature it undergoes allotropic transformation to the BCC phase. Al and V are respective stabilisers of the α and β phases, therefore accurate quantification is essential. The alloy described here is stable in the α +β phase at room temperatures and pressures, whereby slow to intermediate cooling rates allow the formation of α colonies within the β phase.
Figure 1 (left) shows a high resolution forescatter image of the α phase alongside α + β phase, revealing the different topographical natures of these regions. Figure 1 (right) reveals the BCC region overlaid onto the image quality (IQ) map, showing a distinct lamella structure. EDS analysis of V segregation within the BCC phase is shown in figure 2 (left), with the V rich beta phase again highlighted. The quantification of V requires peak deconvolution due to the low weight percentage and the overlap with the Ti spectrum. The contoured quantitative weight percentage map of the same grain is shown in figure 2 (right), in 0.8% step sizes up to a maximum concentration of 8.07% showing a migration of V towards the phase boundary. This example demonstrates the benefits that intelligent EDS can bring to EBSD analysis of complex materials.
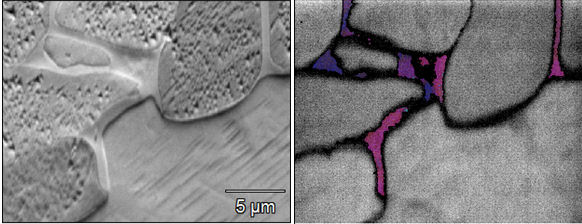
Fig. 1: left: Forescatter SEM image showing a high degree oftopography in the upper left side associated with the α +β phase and a smoother region in the lower rightside of the image assosciated with the a phase. RightBCC Euler map overlaid onto the pattern quality map highlighting theposition of the BCC lamella within the α + β phase |
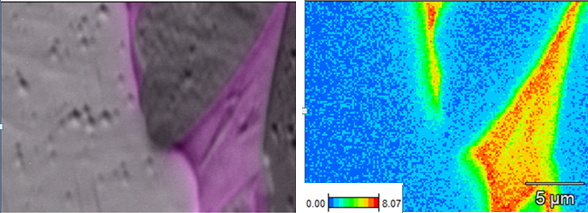
Fig. 2: Left: Quantitative elemental EDS map of vanadium, associated with the β-phase, overlaid onto the forescatter SEM image. Right: Quantitative EDS map in gradients of 0.8 %, revealing a higher concentration of V at the phase boundary |