IT-2-O-3292 Position resolved single electron response of the HAADF-STEM detector and improved method for intensity normalisation
Quantification of HAADF-STEM images as demonstrated in [1,2] is based on normalising the image intensity with respect to the incident electron beam and comparison with image simulations. For that the electron beam is scanned over the detector and the intensities Iout outside and Idet on the detector yield the normalized intensity Inorm=(I-Iout)/(Idet-Iout).
Recently, it has been shown that accidental electrons can hit the HAADF detector, although the electron beam is scanned in a specimen free area [3]. From such a “vacuum image” the number of counts caused by a single electron can be inferred and intensity can be scaled in units of electrons per pixels which enables an alternative way for STEM image quantification [3] and error estimation based on electron statistics.
In this contribution we show that accidentally impinging electrons cause artifacts in the normalization of image intensity using the detector scan technique (DST) [1,2]. We introduce an improved DST which is able to avoid such errors. In addition, we demonstrate a method for measuring single electron signals as a function of detector position.
The red line in Fig. 1 depicts a linescan through an HAADF image of an a-C wedge evaluated using the conventional DST. The normalised intensity exhibits a significant shift towards negative intensities in vacuum. This can be attributed to accidentally impinging electrons [3], whose dose is different for a detector scan (image mode) and a vacuum scan (diffraction mode). To account for this difference we suggest to replace Iout in the numerator by the intensity Ivac obtained from a vacuum scan. The result of this is shown by the blue line in Fig. 1, where the intensity in the vacuum region vanishes. Fig. 2 shows histograms of vacuum images for different dwell times, revealing a large peak at 9900 due to the background level of the detector as well as further peaks corresponding to one or more electrons per scan position. Different dwell times yield fundamentally different curves so that Ivac depends on dwell time. Therefore, vacuum scan and image scan must be performed with the same dwell time.
We also measured the spatially resolved response of the detector to a single electron by drastically decreasing the beam current and taking a series of 256 detector scans with 2048 by 2048 pixels. The position of the single-electron peak was measured in bins of 16 by 16 pixels and the position of the zero-electron peak was subtracted. Fig. 3 nicely depicts the position sensitive single-electron response.
[1] J. M. LeBeau and S. Stemmer, Ultramicroscopy, 108, 1653 (2008).
[2] A. Rosenauer et al., Ultramicroscopy, 109, 1171 (2009).
[3] R. Ishikawa, et al., Microscopy and Microanalysis, 20, 99 (2014).
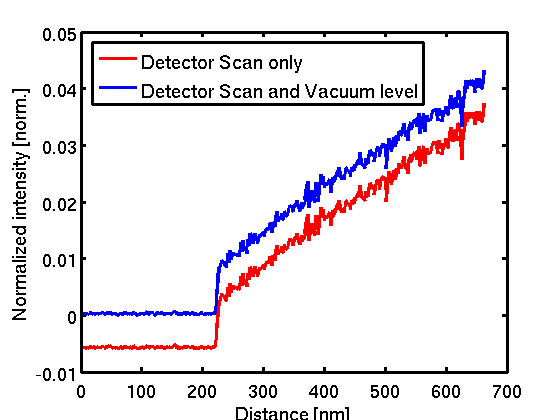
Fig. 1: Normalized intensity along a linescan. Normalization was done using Iout and Idet as derived from a detector scan (red) as well as using the background level from the vacuum image (blue). |
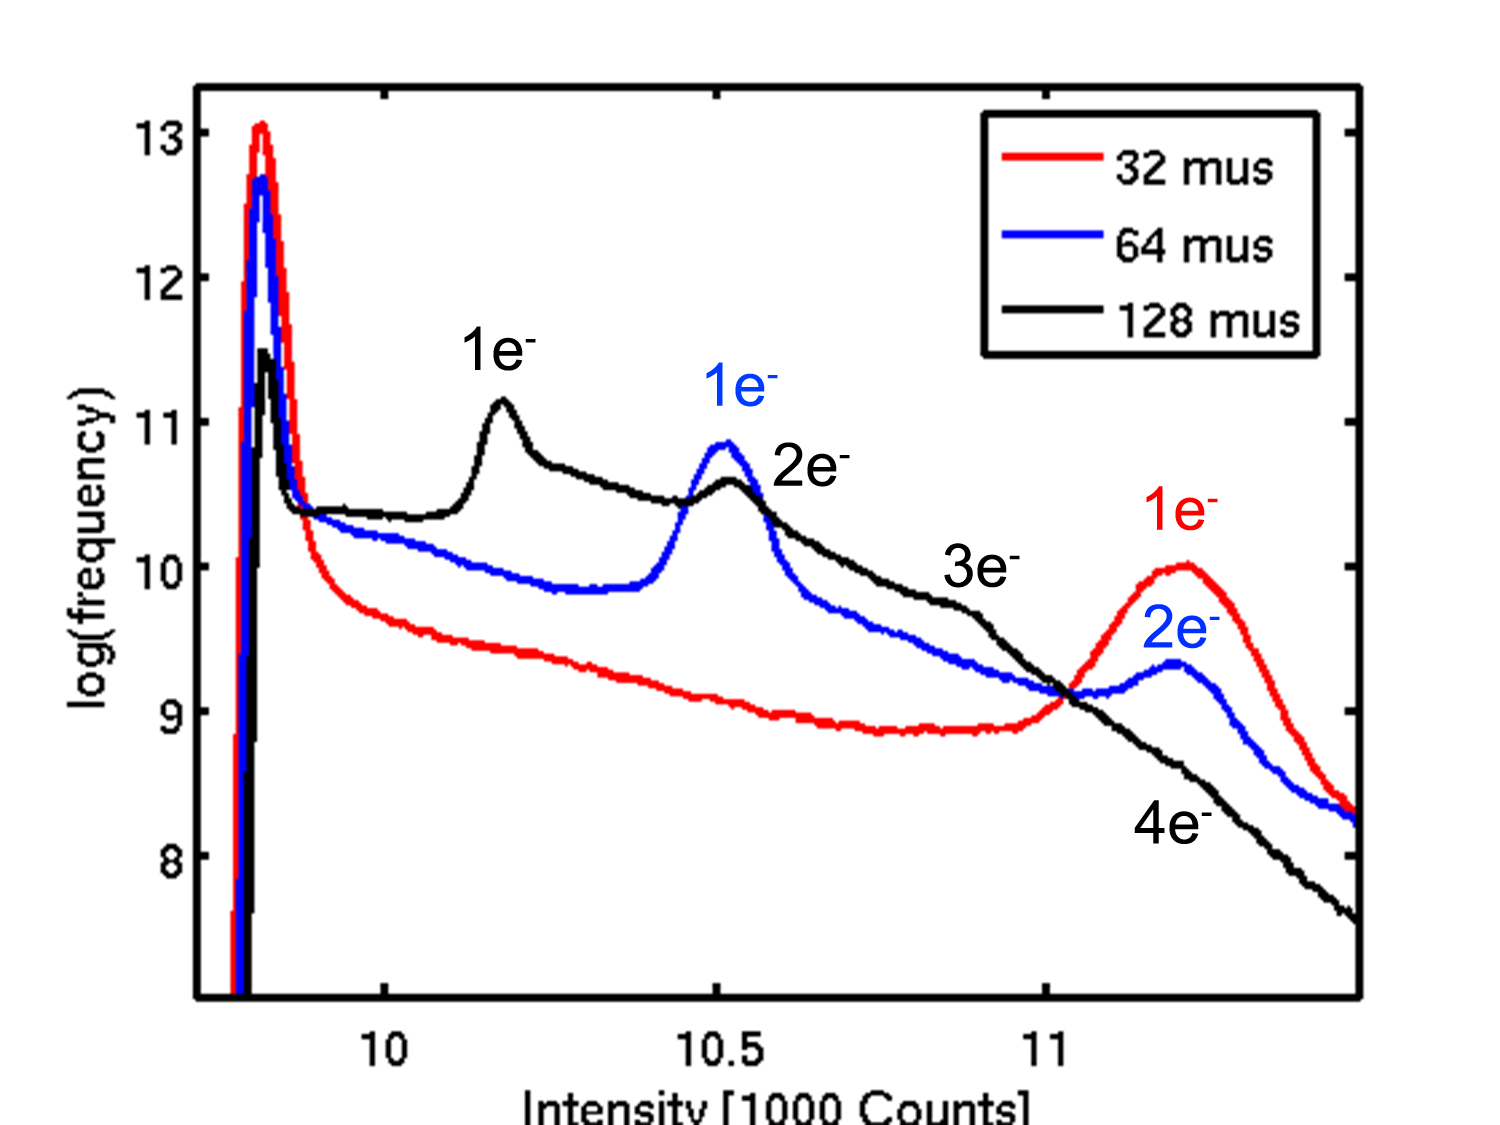
Fig. 2: Log. of the freq. of intensities in vacuum images for different dwell times. Each curve shows peaks corresponding to one or more electrons impinging on a certain pixel. The intensity is normalised with respect to the dwell time, so that the distance between e.g. one-electron peak and zero-electron peak is inversely proportional to the dwell time. |

Fig. 3: Two-dimensional map showing the one-electron response as a function of position on the detector. |
|