IT-5-O-3209 Oxygen Vacancies at Grain Boundaries in Doubly-Doped Ceria Determined using EELS
In oxygen conducting ceramics like CeO2, O2- diffusion occurs via thermally-activated hopping through vacancies whose concentration can be modulated by doping with aliovalent cations such as Gd3+ or Pr3+. Sluggish ionic conductivity in these polycrystalline electrolytes has been attributed in part to highly resistive grain boundaries (GBs) which degrade total ionic conductivity. Here we use a combination of electrochemical impedance spectroscopy (EIS) and electron energy-loss spectroscopy (EELS) to characterize the electrical conductivity and vacancy concentration of GBs in Gd-doped CeO2 also containing Pr or Co.
Gd-doped (GDC), Gd/Pr doubly-doped (GPDC) and a series of Gd/Co doubly-doped CeO2 ceramics were prepared using a spray drying approach together with traditional ceramic processing techniques. EIS was performed using a Gamry Reference 3000 potentiostat, and EELS was performed using a Nion UltraSTEM100. To facilitate interpretation of the EELS data, FEFF codes [1] were employed to simulate the CeO2 O K-edge spectra as a function of oxygen vacancy concentration.
Fig. 1a shows a simulation of the O K-edge in CeO2 as a function of O2- vacancy concentration. In this model, the vacancies were randomly distributed in the fluorite structure. These results indicate a decrease in the first peak in the O-K edge fine structure with increasing vacancy concentration. Figs. 1b and 1c show experimental Ce M45 and O-K near edge structure acquired at the edge and center of a CeO2 particle. The Ce white line intensity switch is characteristic of Ce4+ reduction to Ce3+, and in this case is accompanied by a drop in the first O K-edge peak similar to that in the calculated spectra (1a).
Conductivity data (fig. 2a) shows that the GB conductivity is an order of magnitude higher in GPDC compared to GDC. Figs. 2b and 2c show Ce white lines and O K-edge fine structure acquired at a GB and grain interior in GPDC. In this case the drop in the first O K-edge peak is not accompanied by a Ce white line intensity switch.
Here we probe and correlate the cation distribution, oxidation state and the O K-edge fine structure to elucidate the vacancy environment at GBs in various doped CeO2 electrolytes. These measurements coupled with macroscopic characterization of GB conductivity will be used to relate atomic-level GB structure and chemistry with bulk electrical properties. We also aim to refine our FEFF calculations to improve the quantitative robustness of our experimental approach to determining the distribution of O2- vacancies near GBs.
References
[1] Rehr, J.J, et al., Phy. Chem. Chem. Phy., 2010 12 5503-5513
We thank Kevin Jorrisen for FEFF help, NSF GRFP-1311230 & DMR-1308085, ASU NASA Space Grant & ASU Cowley HREM Center
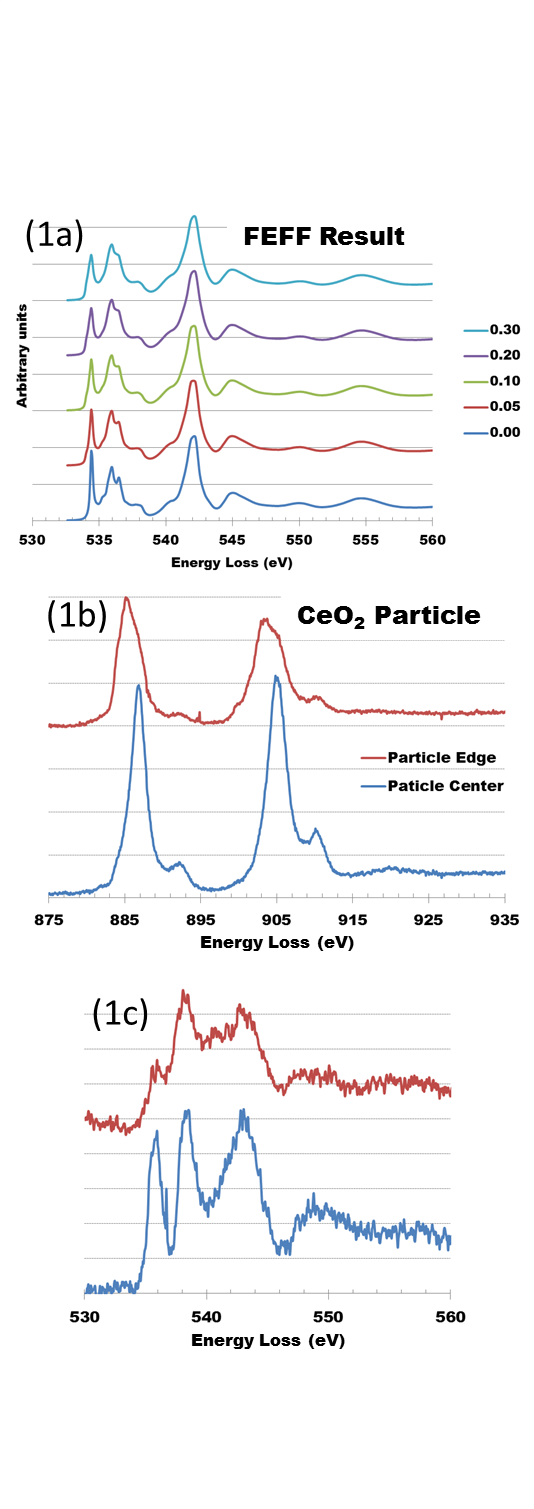
Fig. 1: (a) Calculated EELS O K-edge near-edge structure as a function of O2- vacancy in CeO2. The intensity of the first peak drops with increasing vacancy concentration. (b & c) Experimental Ce M45 white lines and O K-edge near edge structure acquired at the edge and center of a CeO2 particle. |
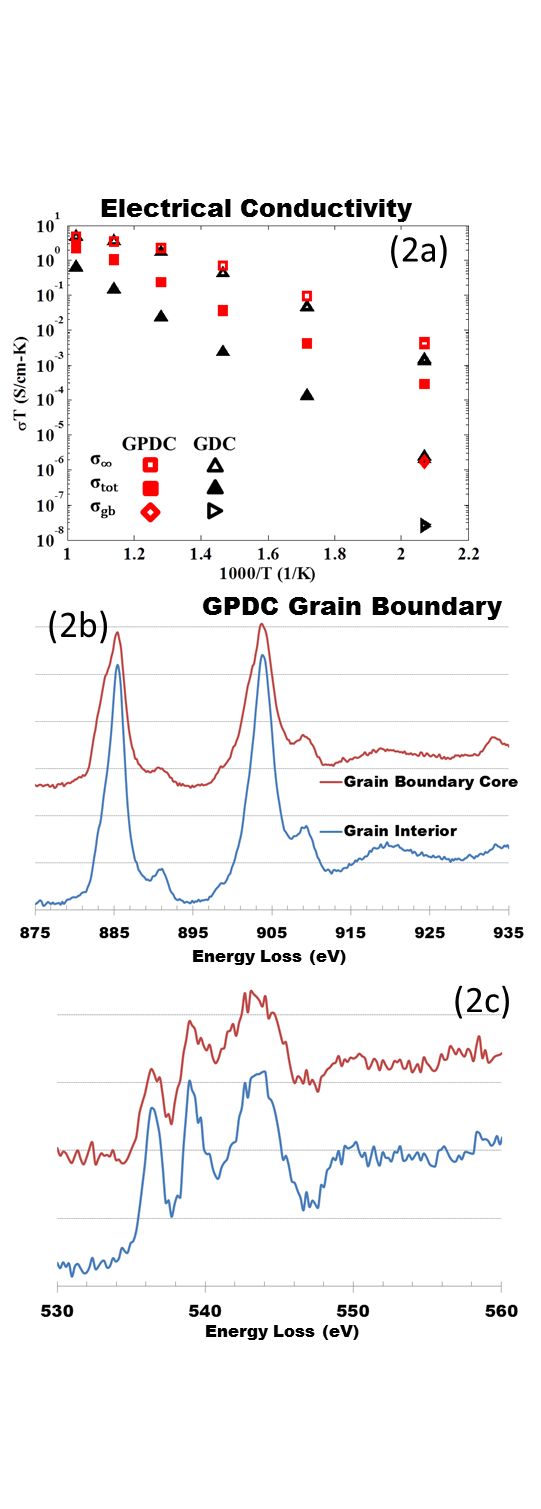
Fig. 2: (a) Conductivity data showing the much higher GPDC grain boundary conductivity, σgb (◊). (b & c) Experimental Ce M45 white lines and O K-edge near edge structure acquired at a grain boundary and grain interior in GPDC. |