IT-2-P-3187 Quantitative analysis of CeO2 and Gd-doped CeO2 nanocrystals by HRTEM focal series restoration
High resolution transmission electron microscopy (HRTEM) is a well-known characterization technique with atomic resolution imaging capability, and different approaches have been explored to extend its use with aim at the retrieval of quantitative information with high spatial resolution. A particular example is the restoration of the electron exit-plane wave-function (EPWF) from HRTEM focal series, as it ideally contains information on the atomic species and their position along individual atomic columns [1]. In this work, we explore the phase shifts on restored EPWFs from CeO2 and Gd-doped CeO2 nanocrystals aiming to extract their local chemical composition with atomic resolution.
HRTEM focal series from nanocrystals in <100> zone axis orientation were obtained using an aberration corrected TEM microscope at 300 kV under a negative Cs-imaging (NCSI) condition [2]. This procedure allowed the imaging of O and Ce-Gd atomic columns with enhanced contrast, as shown in Figures 1a and 2a. Electron EPWF from the two investigated samples were restored from the focal series taking into account the residual aberrations, the instrument instabilities and the detection system (CCD) modulation transfer function (MTF) [3]. Figures 1b and 2b show the respective electron EPWF phases reconstructed for CeO2 and Gd-doped CeO2 nanocrystals. Finally, the local EPWF phase shifts corresponding to the individual atomic columns centers were analyzed and compared to results of multislice image calculations.
The results show that the EPWF phase shift differences between columns containing heavy atoms (Ce or Ce-Gd) are significant with respect to the background, indicating that they can be used to map the atomic columns thicknesses and to infer nanocrystals 3D morphology [4]. Even though the phase shift differences between columns containing light atoms (O) are appreciable, they are on the same range of the background phase fluctuation. This indicates that spurious contributions to the EPWF, probably related to the carbon support film, the CCD read-out noise and the phase-shift tail from heavy elements, limit the direct extraction of quantitative information for the current experimental setup.
The authors would like to thank Dr. Antonio J. Ramirez and Prof. Edson R. Leite for the fruitful discussions that contributed to this project.
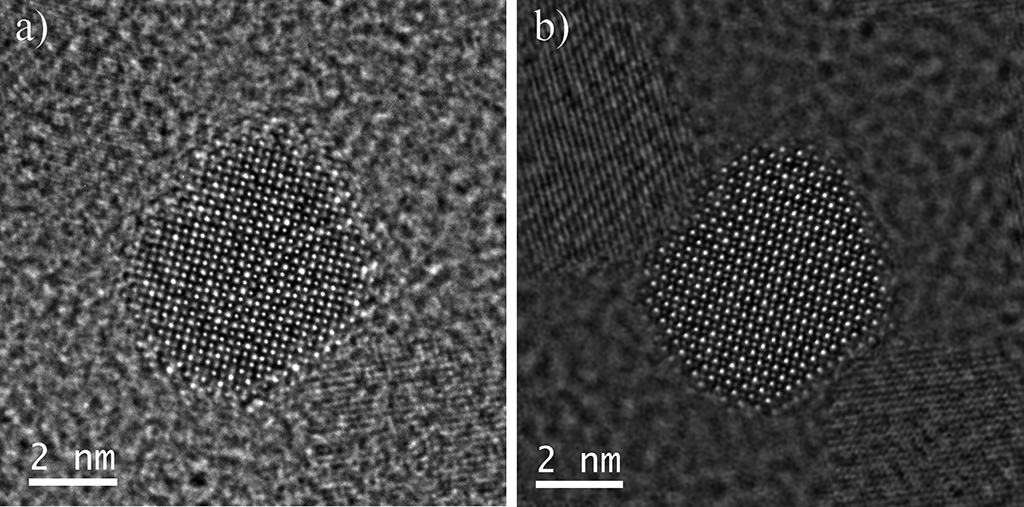
Fig. 1: Figure 1: a) HRTEM image and b) phase from the reconstructed EPWF after a HRTEM focal series from a CeO2 nanocrystal. While the direct identification of Ce and O atomic columns can be ambiguous from a HRTEM image, the reconstructed EPWF phase clearly shows Ce atomic columns with brighter intensity with respect to the O atomic columns. |
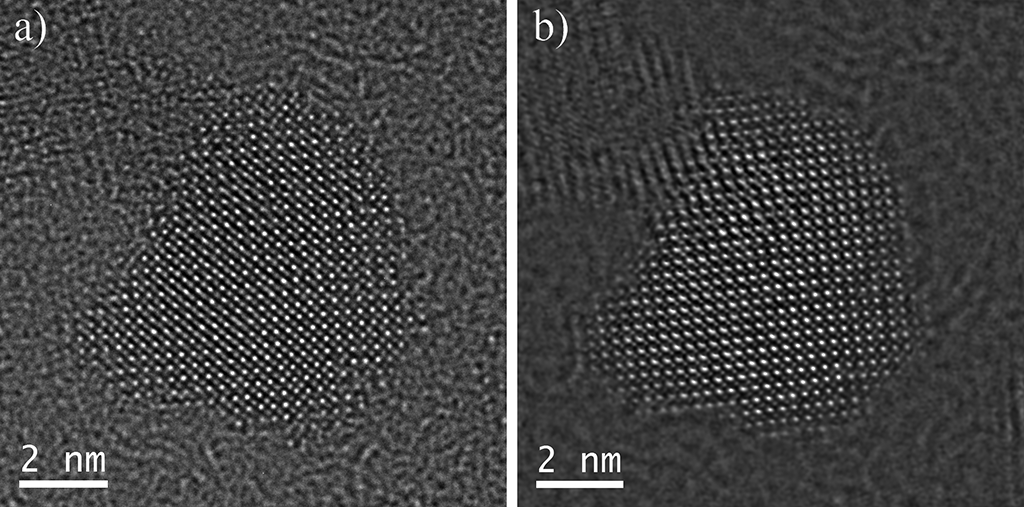
Fig. 2: Figure 2: a) HRTEM image and b) phase from the reconstructed EPWF after a HRTEM focal series from a Gd-doped CeO2 nanocrystal. |