IT-13-P-3033 About the accuracy of post-mortem alignment methods in FIB/SEM nano-tomography
Within the last decade, FIB/SEM tomography has become a commonly used tool for 3D microstructural investigation of materials at a sub-micrometer level [1, 2]. It consists in a true tomographic approach; in a Focused Ion Beam (FIB) microscope coupled with a Scanning Electron Microscope (SEM), the ion beam is used to mill the sample and prepare fresh surfaces which are successively imaged with SEM. The stack of acquired SEM images is then further aligned in order to restore the analysed volume of matter. By alignment, one intends both the drift correction during the acquisition itself [3] and a final post-mortem numerical alignment. The present contribution focuses on this final step: the post-mortem alignment before 3D reconstruction.
Basically, typical post-mortem alignment of the image stack is performed using cross-correlation based algorithms allowing the successive images to be aligned with respect to a reference image. Several methods have thus commonly used [1-5]: the most intuitive method is to define a Region of Interest (ROI) as a reduced frame in the field of view, with the option to locate this ROI near a lateral edge of the scanned area, or at the interface with the top surface of the sample in order to take benefit of an assumed fixed feature which will improve the accuracy of the alignment (fig.1). Further refinements introduced markers, i.e. holes or small trenches machined with the ion beam which will serve as markers facilitating the alignment. It will be demonstrated here that these alignment routines may easily fail, although the final reconstructions generally look correct. The principal issue of all methods mentioned above is due to the fact that they rely on the assumption that the markers, or the microstructure itself, are isotropic, intrinsically ‘fixed’ (with respect to the bulk sample) and not deformed, modified or erased during the 3D acquisition. This is generally not true and this will be demonstrated by dedicated test examples. As illustrated by fig.2 and 3, we will investigate alternative methods in order to improve the alignment and consequently the reliability of the reconstructed volumes. Among these methods, a promising one consists in a correlation with the top surface of the sample which can be reconstructed by stereoscopy prior to the 3D FIB-SEM acquisition and matter removal.
References
[1] L. Holzer,et al., J. of Microscopy 216 (2004), 84.
[2] M. Schaffer, et al., Ultramicroscopy 107 (2007), 587.
[3] H. Yuan in “EMC 2012: Proc.15th EMC, Vol. 2”, ed. D.J. Stokes and J.L. Hutchison, RMS: London, (2012), p. 135.
[4] H. Iwaia, et al., J. Power Sources 195 (2010), 995.
[5] M.D. Uchic et al., Ultramicroscopy 109 (2009), 1229.
[6] K. Lepinay et al., M and M, 19, (2013) 85.
We kindly acknowledge the financial support of Carl Zeiss SAS. Thanks are due to the CLYM (http://www.clym.fr) for the access to the Nvision 40 FIB instrument.
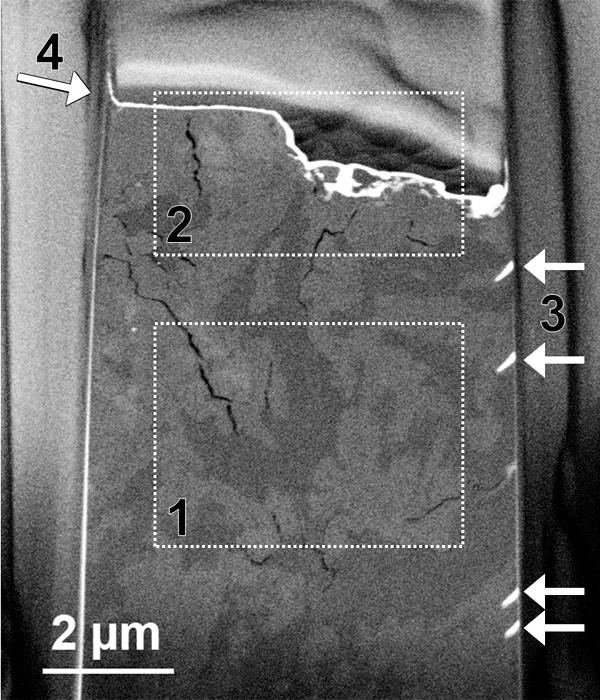
Fig. 1: Front view of the sample (serpentine) during the 3D-FIB analysis. Different ROIs (numbers, frames and arrows) are used for the post-mortem alignment (see fig. 2): ROI3 consists in FIB-milled lateral trenches filled with W (white contrast), whereas ROI4 corresponds to the top surface underlined by a W layer. |
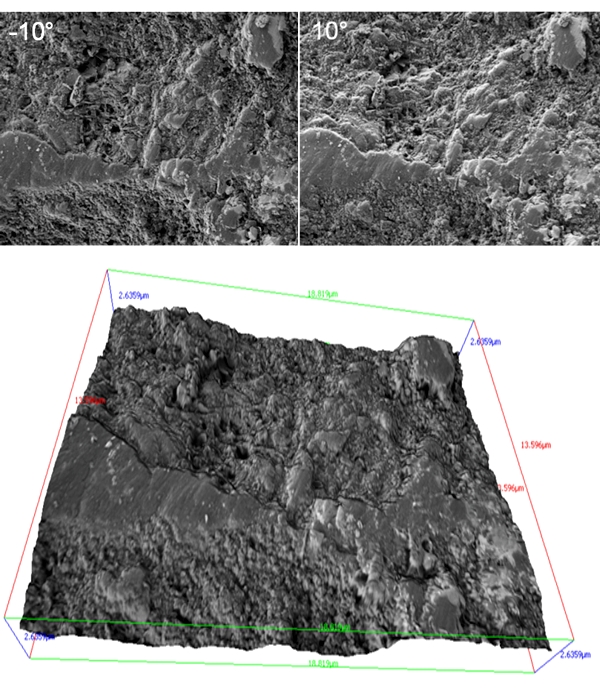
Fig. 2: Reconstruction of the top surface topography from a stereoscopic SEM analysis using 3 images taken at -10°, 10° (shown) and 0° with the help of the MEX program (Alicona SARL, Les Ulis, France). |
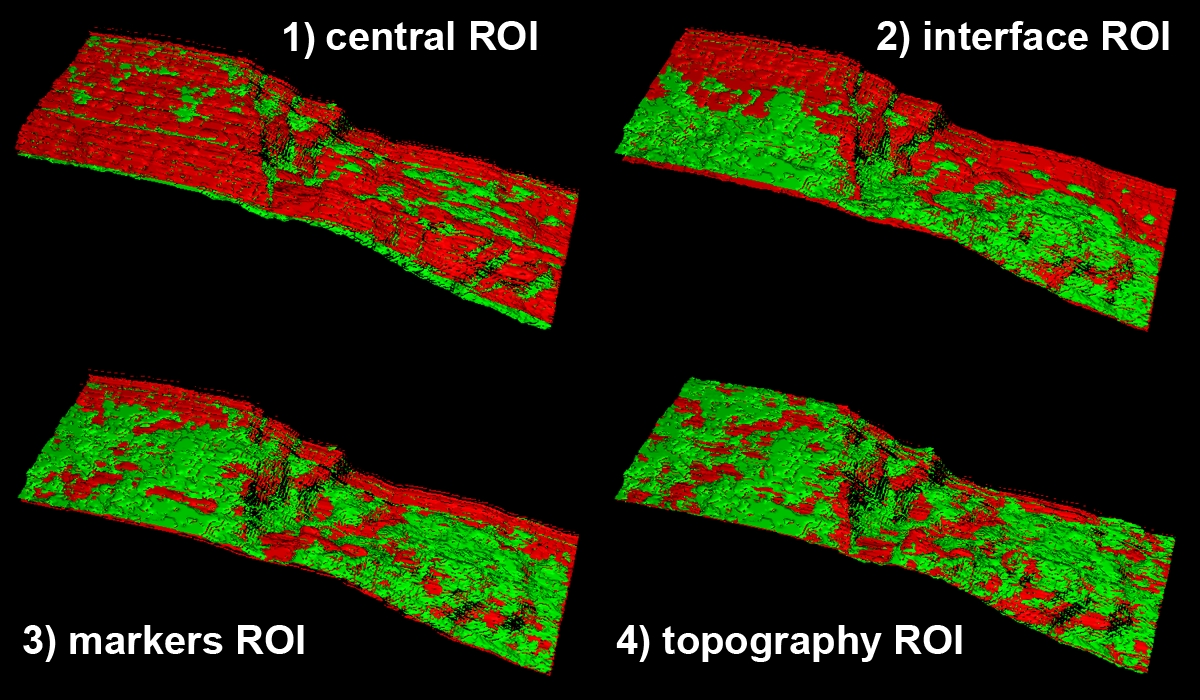
Fig. 3: Superimposition of the top surface as reconstructed by the MEX© procedure (in green) and from the 3D-FIB analysis (in red) for the 4 ROI defined in figure 1. The best correspondence is by far obtained from the alignment based on the surface topography (case 4). |
|