IT-3-P-3025 Measurement and simulation of PSF
Goal of the microscopy is to observe nature and man-made products which are smaller than resolution of human eyes. Microscope should help us to see more details but it has its own limits. One of these limitation is PSF (Point Spread Function). Microscope is device with many lenses and each of the lens can bring some distortion to the final image. When the object is so small that it can be consider as a point the image of this point will be not only the point but set of points. This image is called PSF. It is important to know and describe behavior of the PSF because it helps us to understand how the microscope transfers and shows the image.
Many simulation and measurements were done on the fluorescent microscope, because it is much easier. The difference between bright field and fluorescent microscopy is in the light. In BF the light is scattered by the sample, in fluorescence the light is emitted out of the sample. We tried to use ENZ (Extended Nijboer-Zernike theory) simulation (See Fig. 1). This works for fluorescent microscopy but it fails in BF (See Fig. 2). We tried to measure the PSF in BF (See Fig. 3) under different condition; with different particles (15nm and 200nm) and under different light condition (Light intensity is expressed by current on the LED used for illumination). We came to conclusion that the shape and size of PSF depends not only on parameters described in ENZ like aberration, light wavelength, numerical aperture, size of the particle but also on light intensity.
The size and shape of PSF is connected with the real resolution of the microscope and terms like distinguishability and discriminability. We propose that measuring of PSF should be the basic experiment done with every microscope. Measured PSF should be used as a kernel for deconvolution function for improving microscopy images.
CENAKVA CZ.1.05/2.1.00/01.0024, and CENAKVA II (The results of the project LO1205 were obtained with a financial support from the MEYS under the NPU I program); GA JU 134/2013/Z;
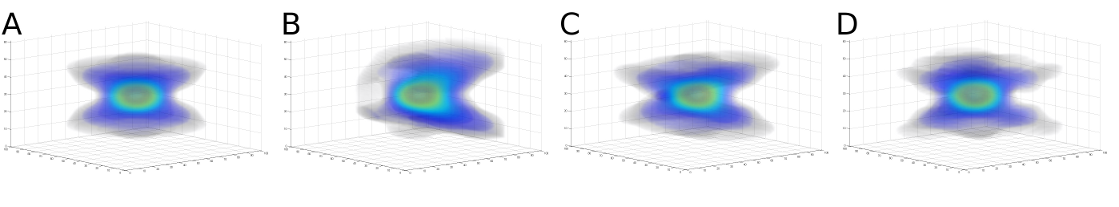
Fig. 1: Different aberration in ENZ Simulation. Parameters of simulation were – wavelength = 200nm, NA (numerical aperture) was 0.5, diameter was 400nm; A – no aberration; B – Coma; C – Tilt; D – Astigmatism |
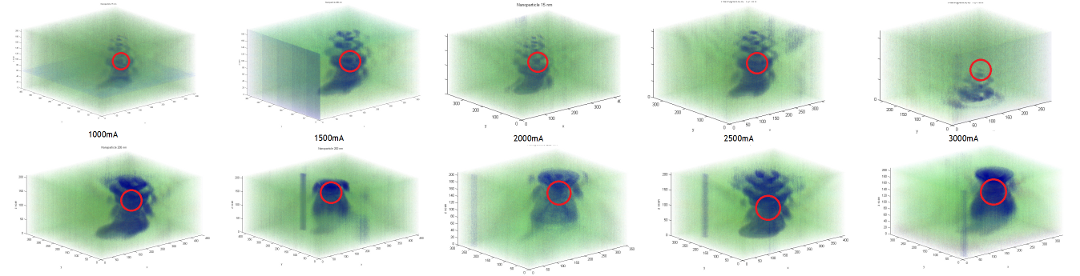
Fig. 2: ferent Light condition – Upper row - 15nm gold particles, Bottom row – 200nm latex particle. Light is increasing from left to right (starts at 1000mA, step 500mA, end at 3000mA) |
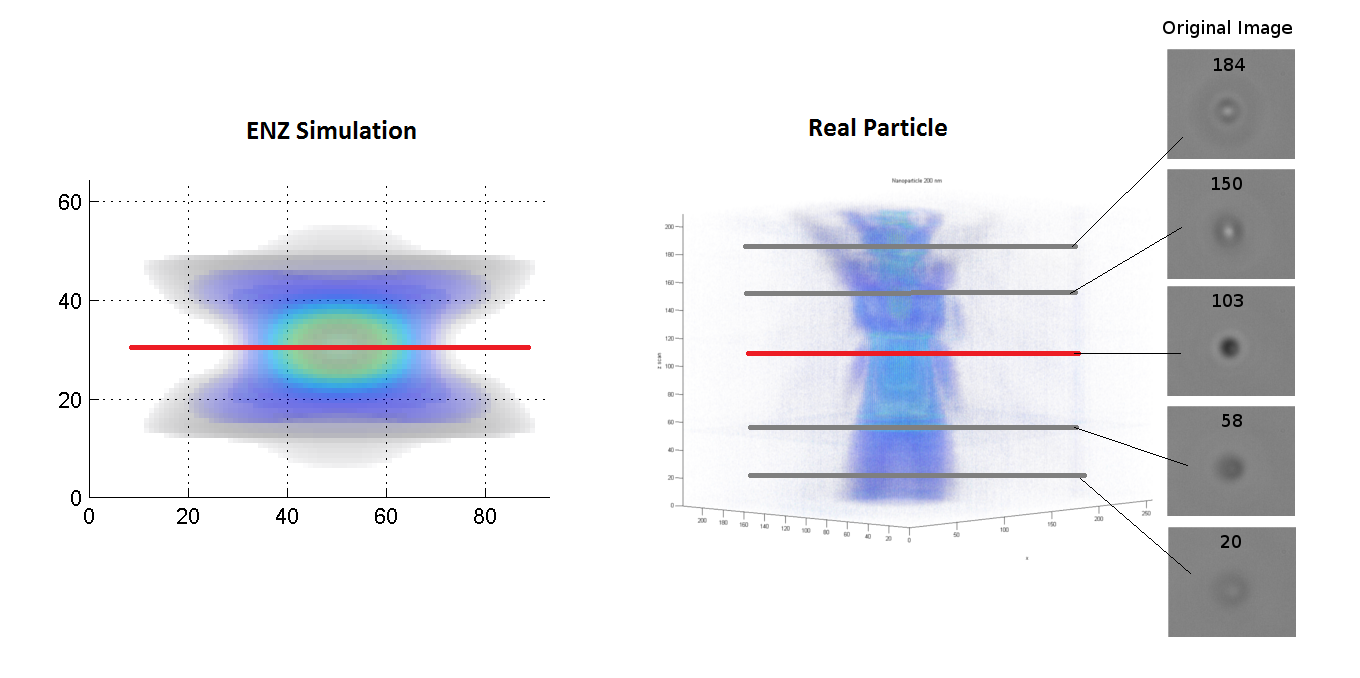
Fig. 3: Comparing of ENZ simulation and real PSF. Red line shows position of focus. Right column shows original images in different distance from focus and appropriate Z position in PSF. |
|