IT-5-P-2969 Valence Electron States of Carbon Materials studied by TEM-SXES
X-ray emission spectroscopy is widely used as a practical tool for compositional analysis of local specimen area and elemental mapping analysis in electron microscopes. X-rays originate form electronic transitions from valence bands (VB, bonding electron states) to inner-shell electron levels inform us energy states of bonding electrons. This X-ray energy ranges in ultrasoft or soft X-ray region form about 0.1 to a few keV. Thus, soft X-ray emission spectroscopy (SXES) based on electron microscopy (EM) can be a sensitive tool for elemental and chemical identifications. For that purpose, we have developed and tested SXES instruments by applying to TEM, EPMA, and SEM [1,2,3]. This SXES spectrometer informs us energy states of VB from specified specimen areas in electron microscopy, which is hardly obtained by EELS and EDS.
Figure 1 shows carbon K-emission (VB→K-shell) spectra of zeolite-Y template carbon (ZTC) [4]. Spectra of graphite and momomer-C60 (Mono.-C60) are also shown for comparison. As this ZTC has a huge surface area of 4000 m2/g, it is a candidate material for applying to fuel cell and electrode of rechargeable batteries. Electron diffraction pattern of ZTC shows amorphous like broad rings. However, C K-emission spectrum shows apparent structures. Those structure positions similar to those of Mono.-C60 than those of graphite. This result suggests that ZTC is mainly composed of curved grapheme, sp2, network with a similar curvature with that of a C60 cluster. Additional structures at the top end and on the lower energy part of VB as indicated by arrows suggest a presence of a certain amount of sp3 component in carbon network of ZTC examined.
When a crystal has anisotropic bonding nature, emission intensities originate from VB electrons should be anisotropic. TEM based SXES experiment can examine this anisotropic emission intensity by changing the crystal orientation. Analyses of anisotropic intensity of C K-emission of graphite by using TEM-SXES have already demonstrated [5]. However, this analysis did not include the effect of polarization on a reflectance of grating used. When the polarization effect was included, the resultant was improved (not shown here). This indicates that the polarization correction is presumably necessary for an accurate analysis of VB of anisotropic crystalline materials by using a grating spectrometer.
[1] M Terauchi et al, Journal of Electron Microscopy 61 (2012), 1.
[2] H Takahashi et al, Microscopy and Microanalysis 19(Suppl.2) (2013), 1258.
[3] M Terauchi et al, Microscopy and Microanalysis, accepted.
[4] K Nueangnoraj et al., CARBON 62 (2013), 455.
[5] M Terauchi in “Transmission Electron Microscopy Characterization of Nanomaterials”, ed. CSSR Kumar, (Springer-Verlag, Berlin Heidelberg) 284.
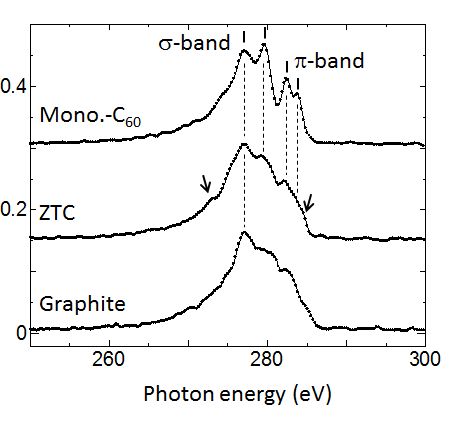
Fig. 1: C K-emission spectra of zeolite-Y template carbon (ZTC), monomer-C60 (Mono.-C60) and graphite. ZTC shows a similar structure with those of Mono-C60 than those of graphite. |