IT-6-O-2933 Operando TEM of CO Oxidation Catalyst by Quantification of Gaseous Reaction Products
In-situ transmission electron microscopy allows materials to be observed at the atomic scale while they are simultaneously subjected to stimuli relevant to some application. Operando TEM goes one step further, and additionally measures some performance metric of the material during the in-situ observation. We have developed a technique for performing operando TEM of a catalyst for CO oxidation, which allows us to quantitatively monitor the gas composition leaving the environmental cell in an FEI Tecnai F20 ETEM [1]. We have done this by two complimentary methods [2]. Electron energy loss spectroscopy (EELS) was used to quantitatively probe the gas composition directly in the sample chamber of the microscope at discreet times in the course of an experiment. Mass spectrometry was simultaneously used to measure the gas composition continuously via a residual gas analyzer attached to the vacuum system near the main turbo-pump which pumps the environmental cell. High resolution images can then be linked to the precise conditions in the cell at all times as seen in Figure 1. All of this was made possible by the introduction of a novel sample preparation technique in which a pellet with a 0.5mm hole in the center was formed from glass-wool fibers, and impregnated with a silica-sphere supported catalyst. This pellet was then placed into a Gatan heating holder along with a metallic grid, which was also covered in the silica-sphere supported catalyst. This approach is currently being adapted to an aberration corrected FEI Titan ETEM.
Some of the initial results of this technique are shown in Figure 3. High resolution images of individual particles are placed into context within the operando experiment using a plot of the mol fraction of CO2 determined using EELS. A hysteresis of the CO conversion is clearly seen as the temperature is ramped up and then back down over a period of several hours. The EELS data which was acquired in the core loss region of the spectrum was quantified using a linear combination method to fit the carbon k edge π* peaks from CO and CO2, as shown in Figure 2. Changes in the structure of the Ru-RuO2 catalyst are clearly seen, including transitions from an oxidized to a reduced state at temperatures above 400°C.
References:
[1] Chenna, S. and Crozier, P. A. ACS Catalysis 2, 2395-2402. (2012).
[2] Miller, B. K. and Crozier, P. A. Microscopy and Microanalysis, 2014 (in press)
Financial support from National Science Foundation CBET-1134464 and the Fulton Schools of Engineering at ASU, and the use of ETEM at John M. Cowley Center for HR Microscopy at Arizona State is gratefully acknowledged.
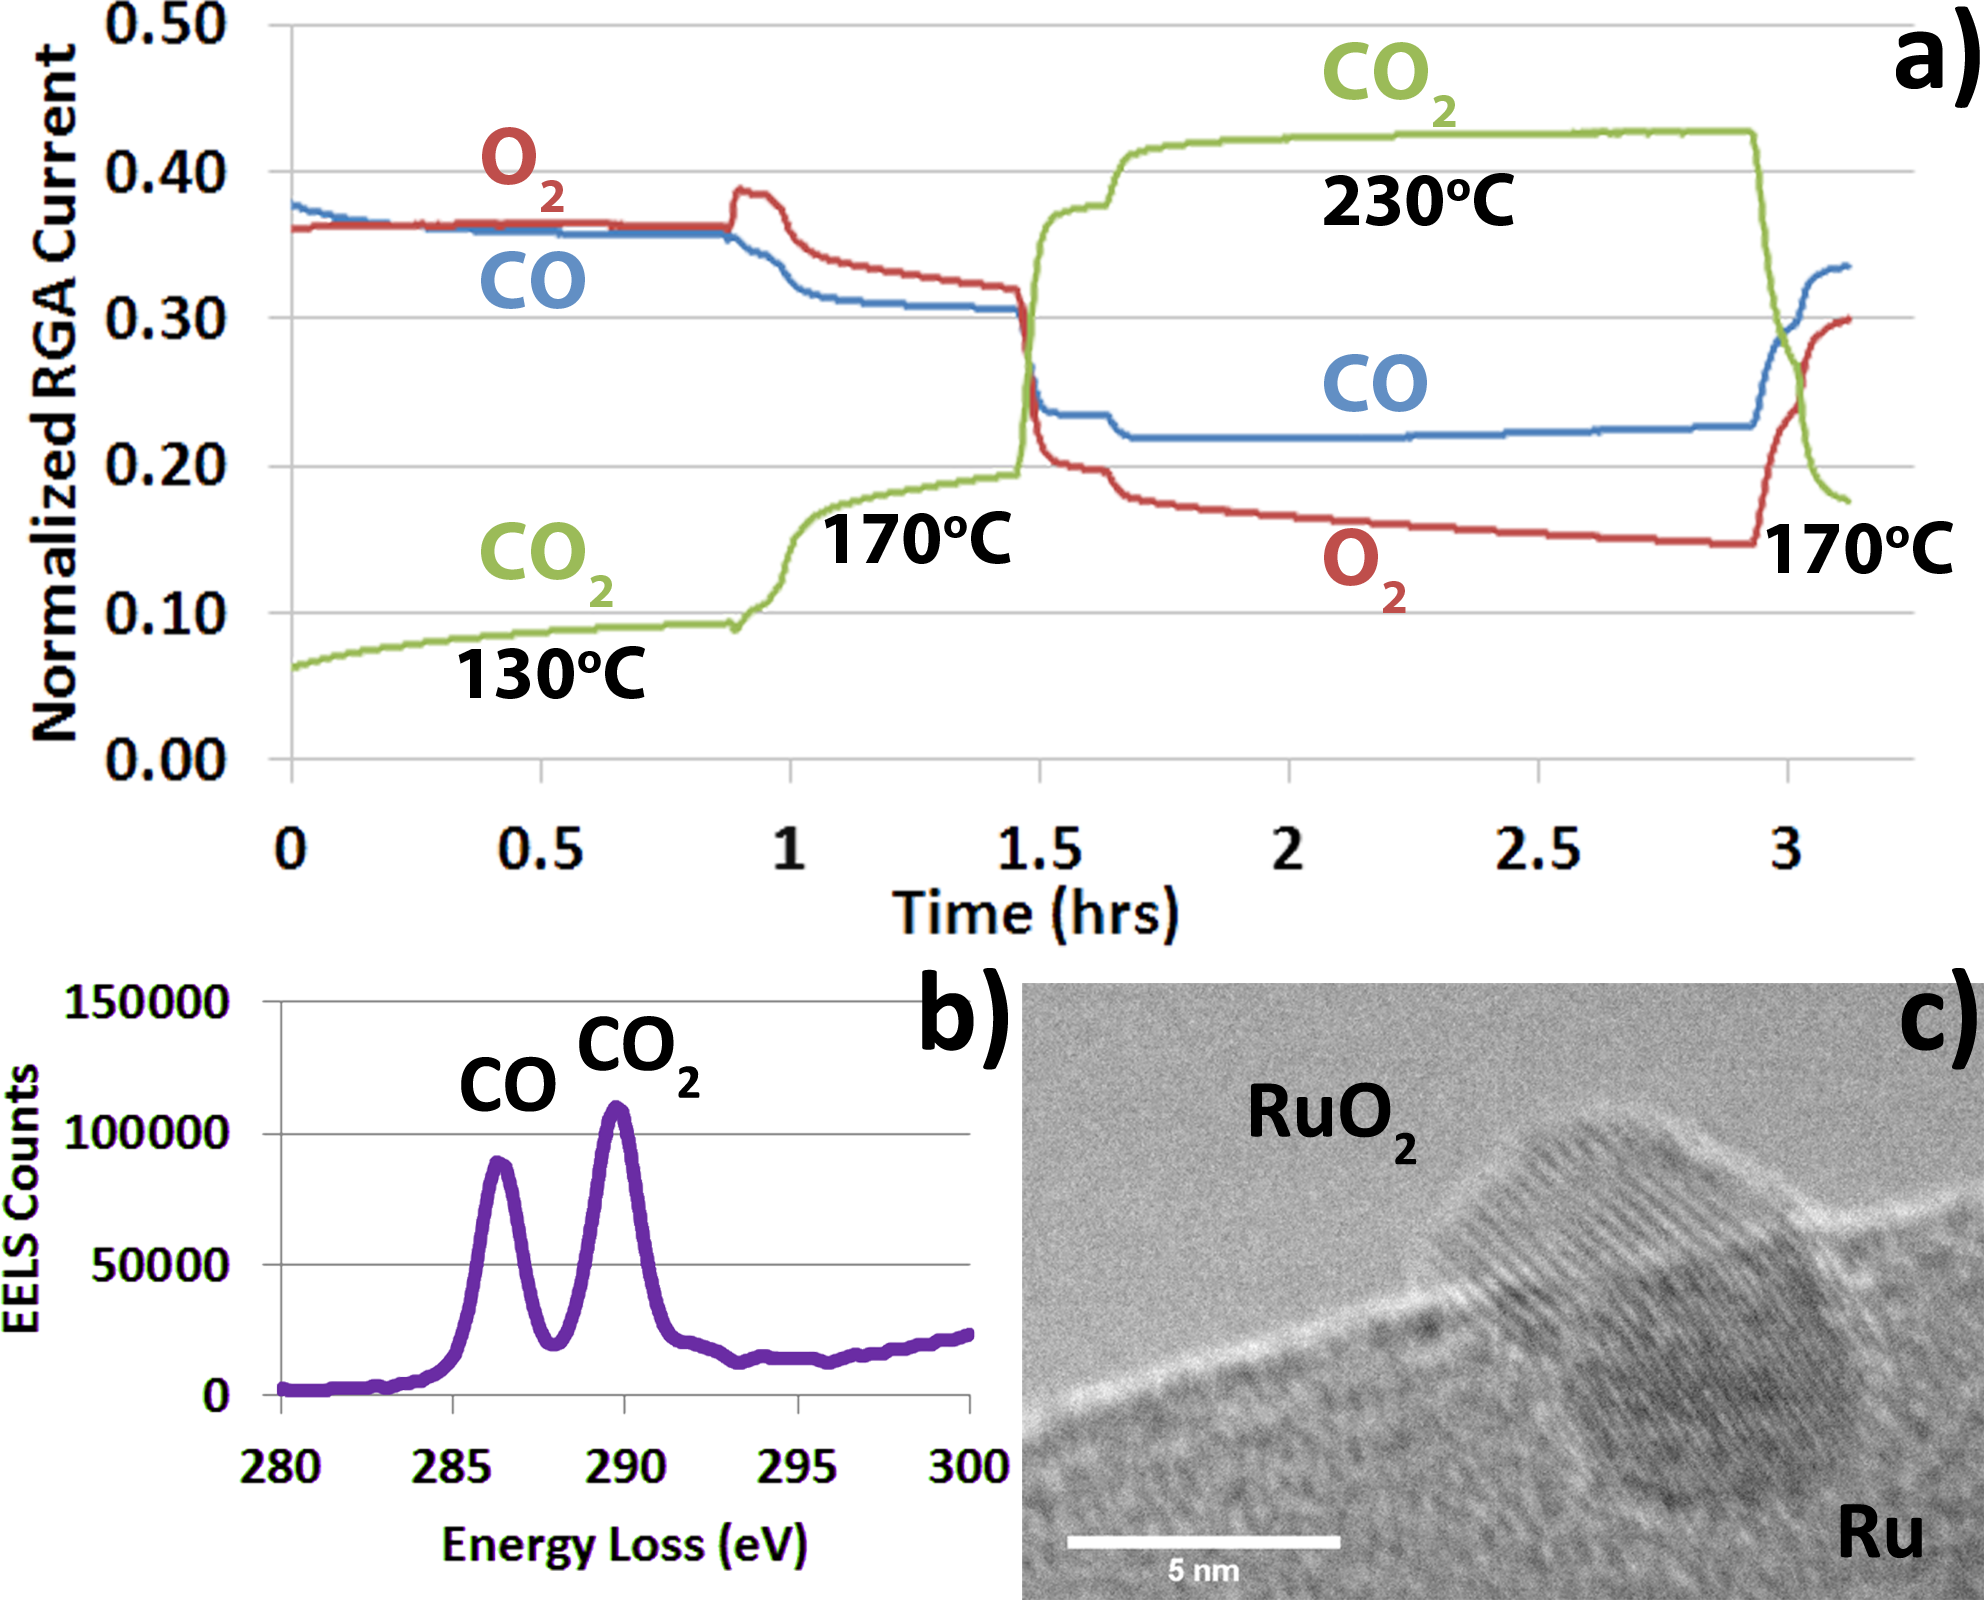
Fig. 1: Operando data from CO oxidation experiment. a) Mass spectrometry data from residual gas analyzer (RGA), showing a sudden increase in CO2 as the temperature is increased to 230°C. b) Core loss EELS data with peaks from both CO and CO2. c) High resolution image acquired at the same condition as the EELS data. |
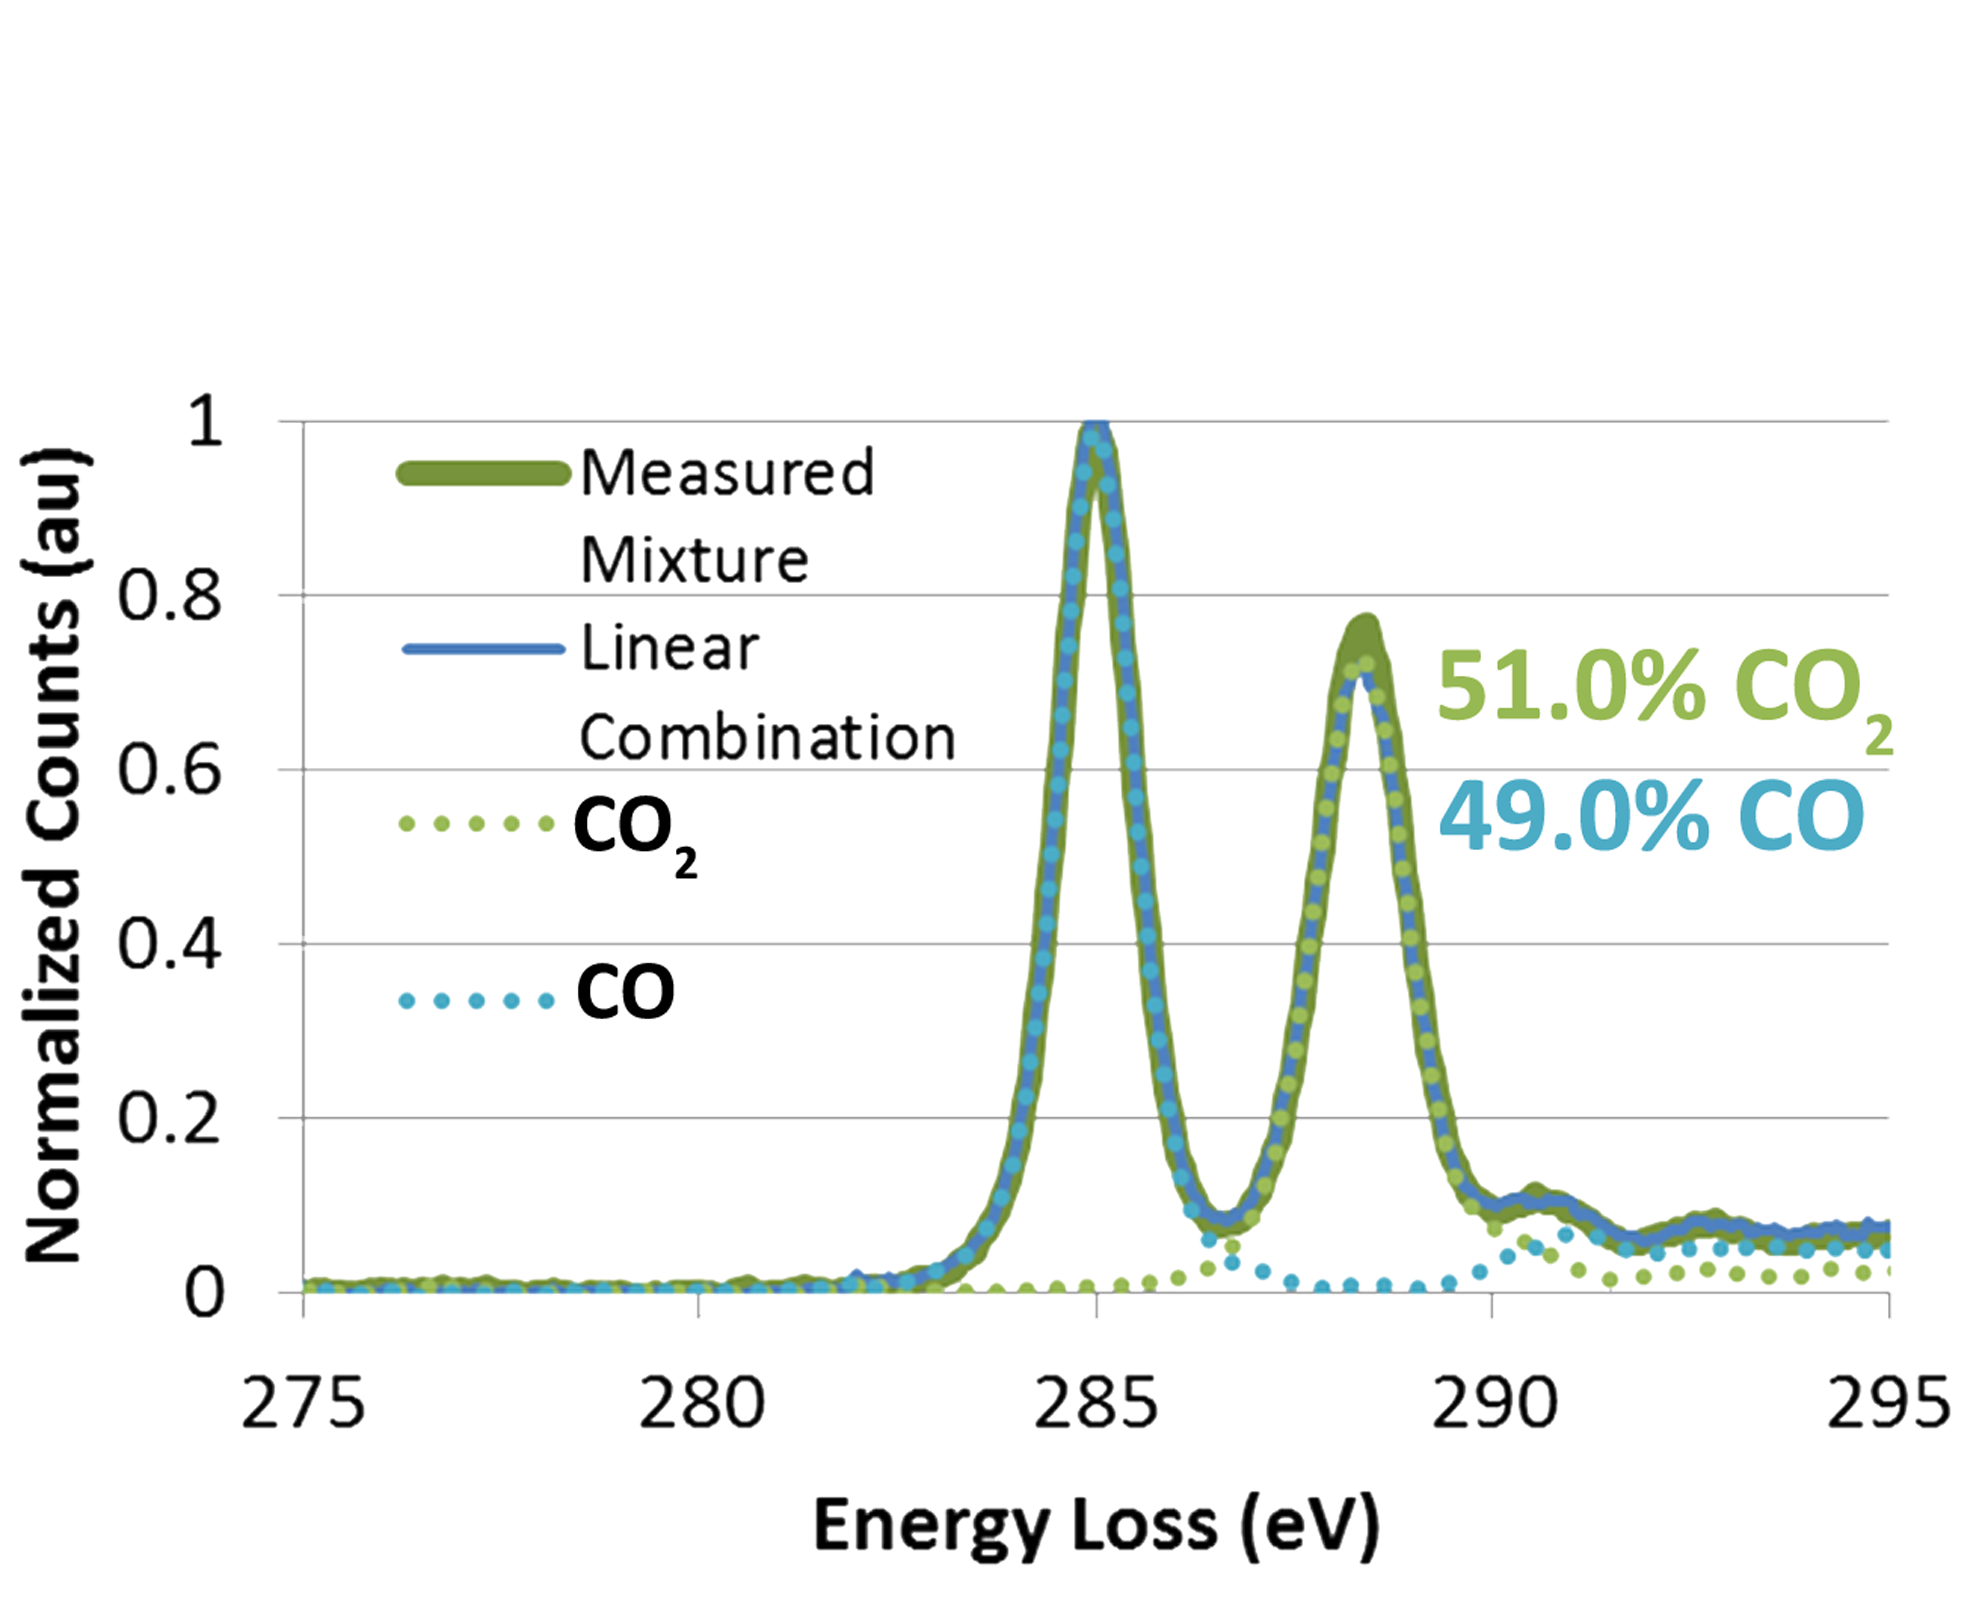
Fig. 2: Method for quantifying the CO2 conversion from core loss EELS data by a linear combination of reference spectra. After background subtraction of both the reference and mixture measured spectra, a least squares fitting method is implemented in MATLAB allowing precise determination of the ratio of CO to CO2 in the gas phase. |
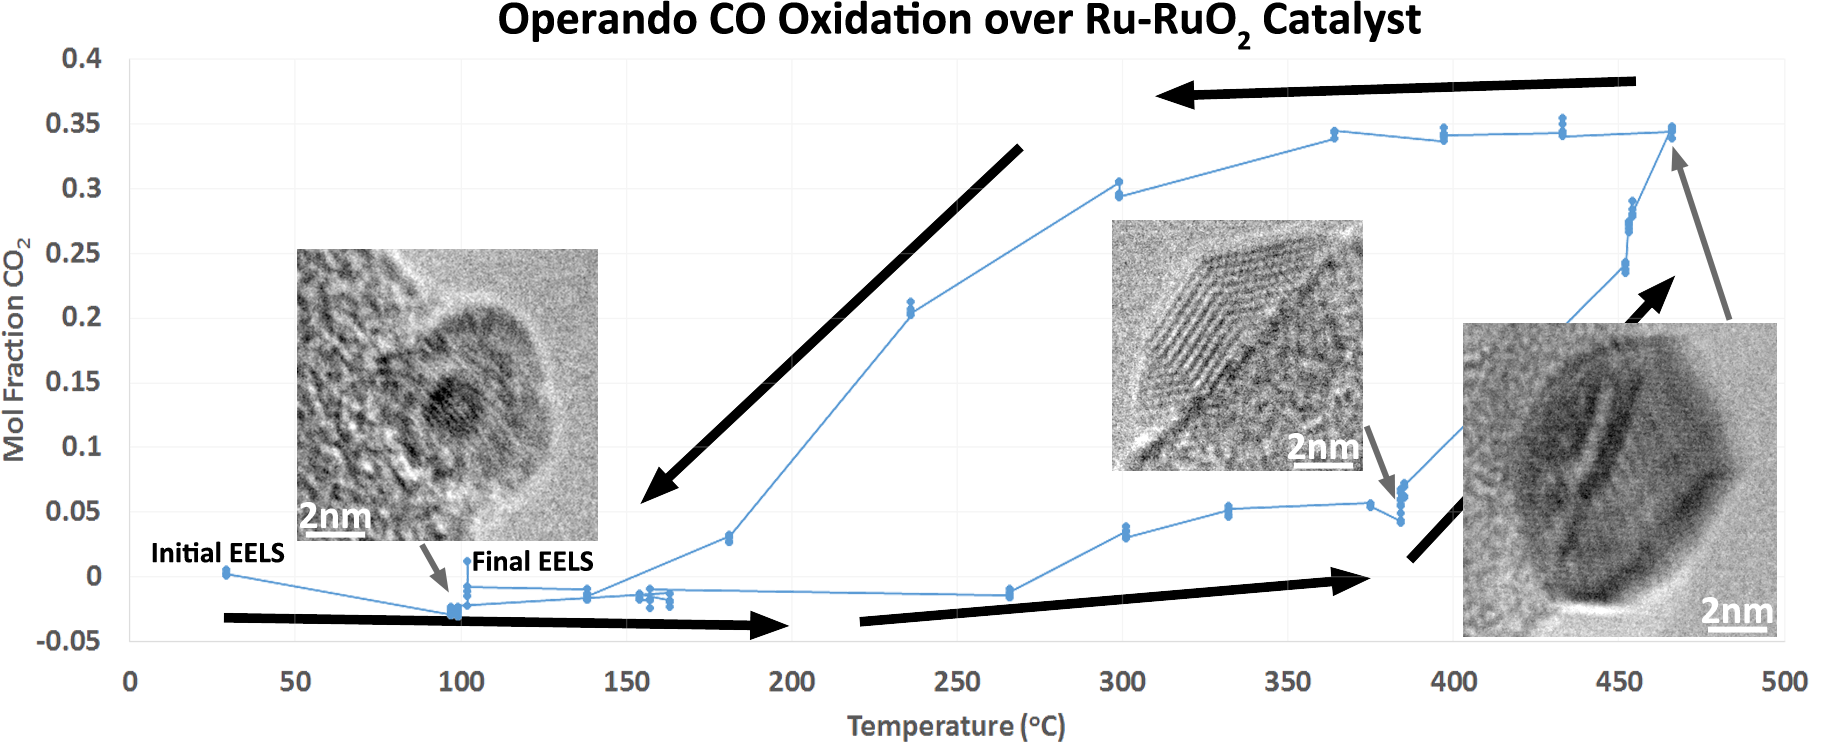
Fig. 3: Mole fraction of CO2 as a function of temperature determined by analysis of core-loss EELS spectra. The data show a clear hysteresis as the temperature is increased and then decreased. This is attributed, in part, to the reduction of the initially oxidized Ru. Images at three temperatures illustrate the changes in the catalyst structure. |
|