IT-2-P-2922 Real Space Characterization of the Finite Shape of the STEM Probe
The shape and size of the electron probe impact many aspects of scanning transmission electron microscopy (STEM), including resolution in imaging and related STEM spectroscopies. This work introduces the projective standard deviation (PSD) as a tool for examining the shape of the STEM probe from atomic resolution images of a reference material. The PSD possesses sensitivity to the shape and intensity of atom columns in a STEM image and has already proven pivotal in the recently developed Revolving-STEM (RevSTEM) technique for eliminating drift related image distortions [1].
The PSD utilizes the normalized Radon transformation mathematical construction that projects the normalized integrated intensities of an image onto an orthogonal vector; this transformation oriented along a lattice vector results in a profile with sharp, periodic oscillations while a projection away from a lattice vector forms a profile with nearly flat intensity. Fig. 1 (a) shows transformations over a 180° range for a simulated Si <100> image. Fig. 1 (b) displays the transformations at 45° (red oscillating line) and 60° (blue dashed line with comparatively flat intensity) from Fig. 1 (a) which are oriented along and away from lattice vectors, respectively. The standard deviation of a normalized Radon transformation over a desired angle range generates a PSD plot with standard deviation as a function of angle. Projection perpendicular to lattice vectors results in large standard deviations, while angles oriented away from lattice vectors result in small standard deviations, as exemplified by the peaks and flat regions of the PSD plot in Fig 2 (a).
We demonstrate herein that the comparison between the PSD of an experimental image and the PSDs of simulated images enables the identification of the probe shape for a given microscope and image. Fig. 2 (a) illustrates this principle as the PSD of a simulated Si <100> image convolved with a Gaussian function (FWHM 0.10 nm by 0.10 nm; red line) differs substantially from the PSD of the same simulated image convolved with an astigmatic Gaussian function (FWHM 0.10 nm by 0.07 nm; dashed blue line). Iterative least-squares fitting of PSD plots allows determination of a probable probe shape for given conditions. Fig. 2 (b) shows the fitting of a PSD of a background subtracted experimental Si <100> RevSTEM micrograph (red line) with the PSD of a simulated Si <100> image convolved with a Gaussian function of FHWM 0.102 nm by 0.092 nm and ~45° rotation (blue dashed line). Strikingly, the simulated Si <100> image with added noise (Fig. 2 (d)) is almost identical to the background noise subtracted experimental RevSTEM Si <100> image (Fig. 2 (c)).
Reference: [1] X Sang and JM LeBeau, Ultramicroscopy 138 (2014), p. 28
The authors acknowledge the use of the Analytical Instrumentation Facility (AIF) at North Carolina State University, which is supported by the State of North Carolina and the National Science Foundation, and they acknowledge use of the High Performance Computing (HPC) services at North Carolina State University.
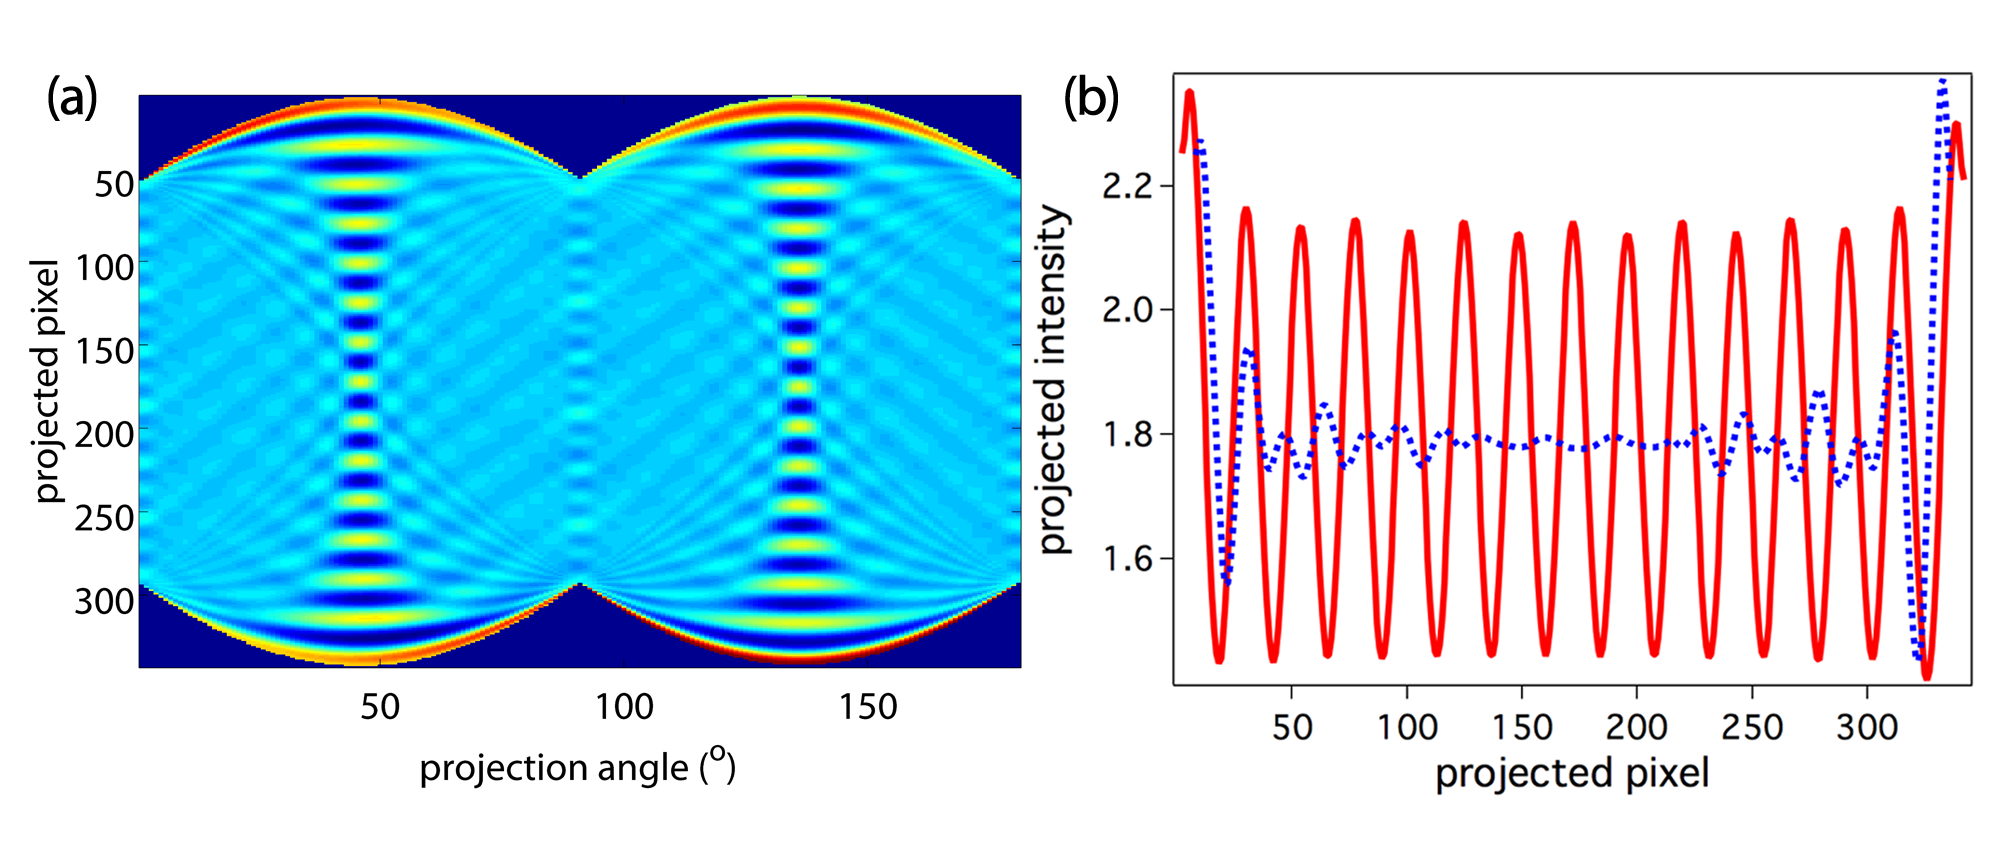
Fig. 1: (a) Normalized Radon transformation spanning 180° of a simulated Si <100> image (~ 3 x 3 cells; 240 x 240 pixel) convolved with a Gaussian (FWHM 0.10 nm by 0.10 nm). (b) 45° (red) and 60° (dashed blue) projection angle line profiles from (a) showing oscillation at 45° and comparatively flat intensity at 60° due alignment with a lattice vector. |
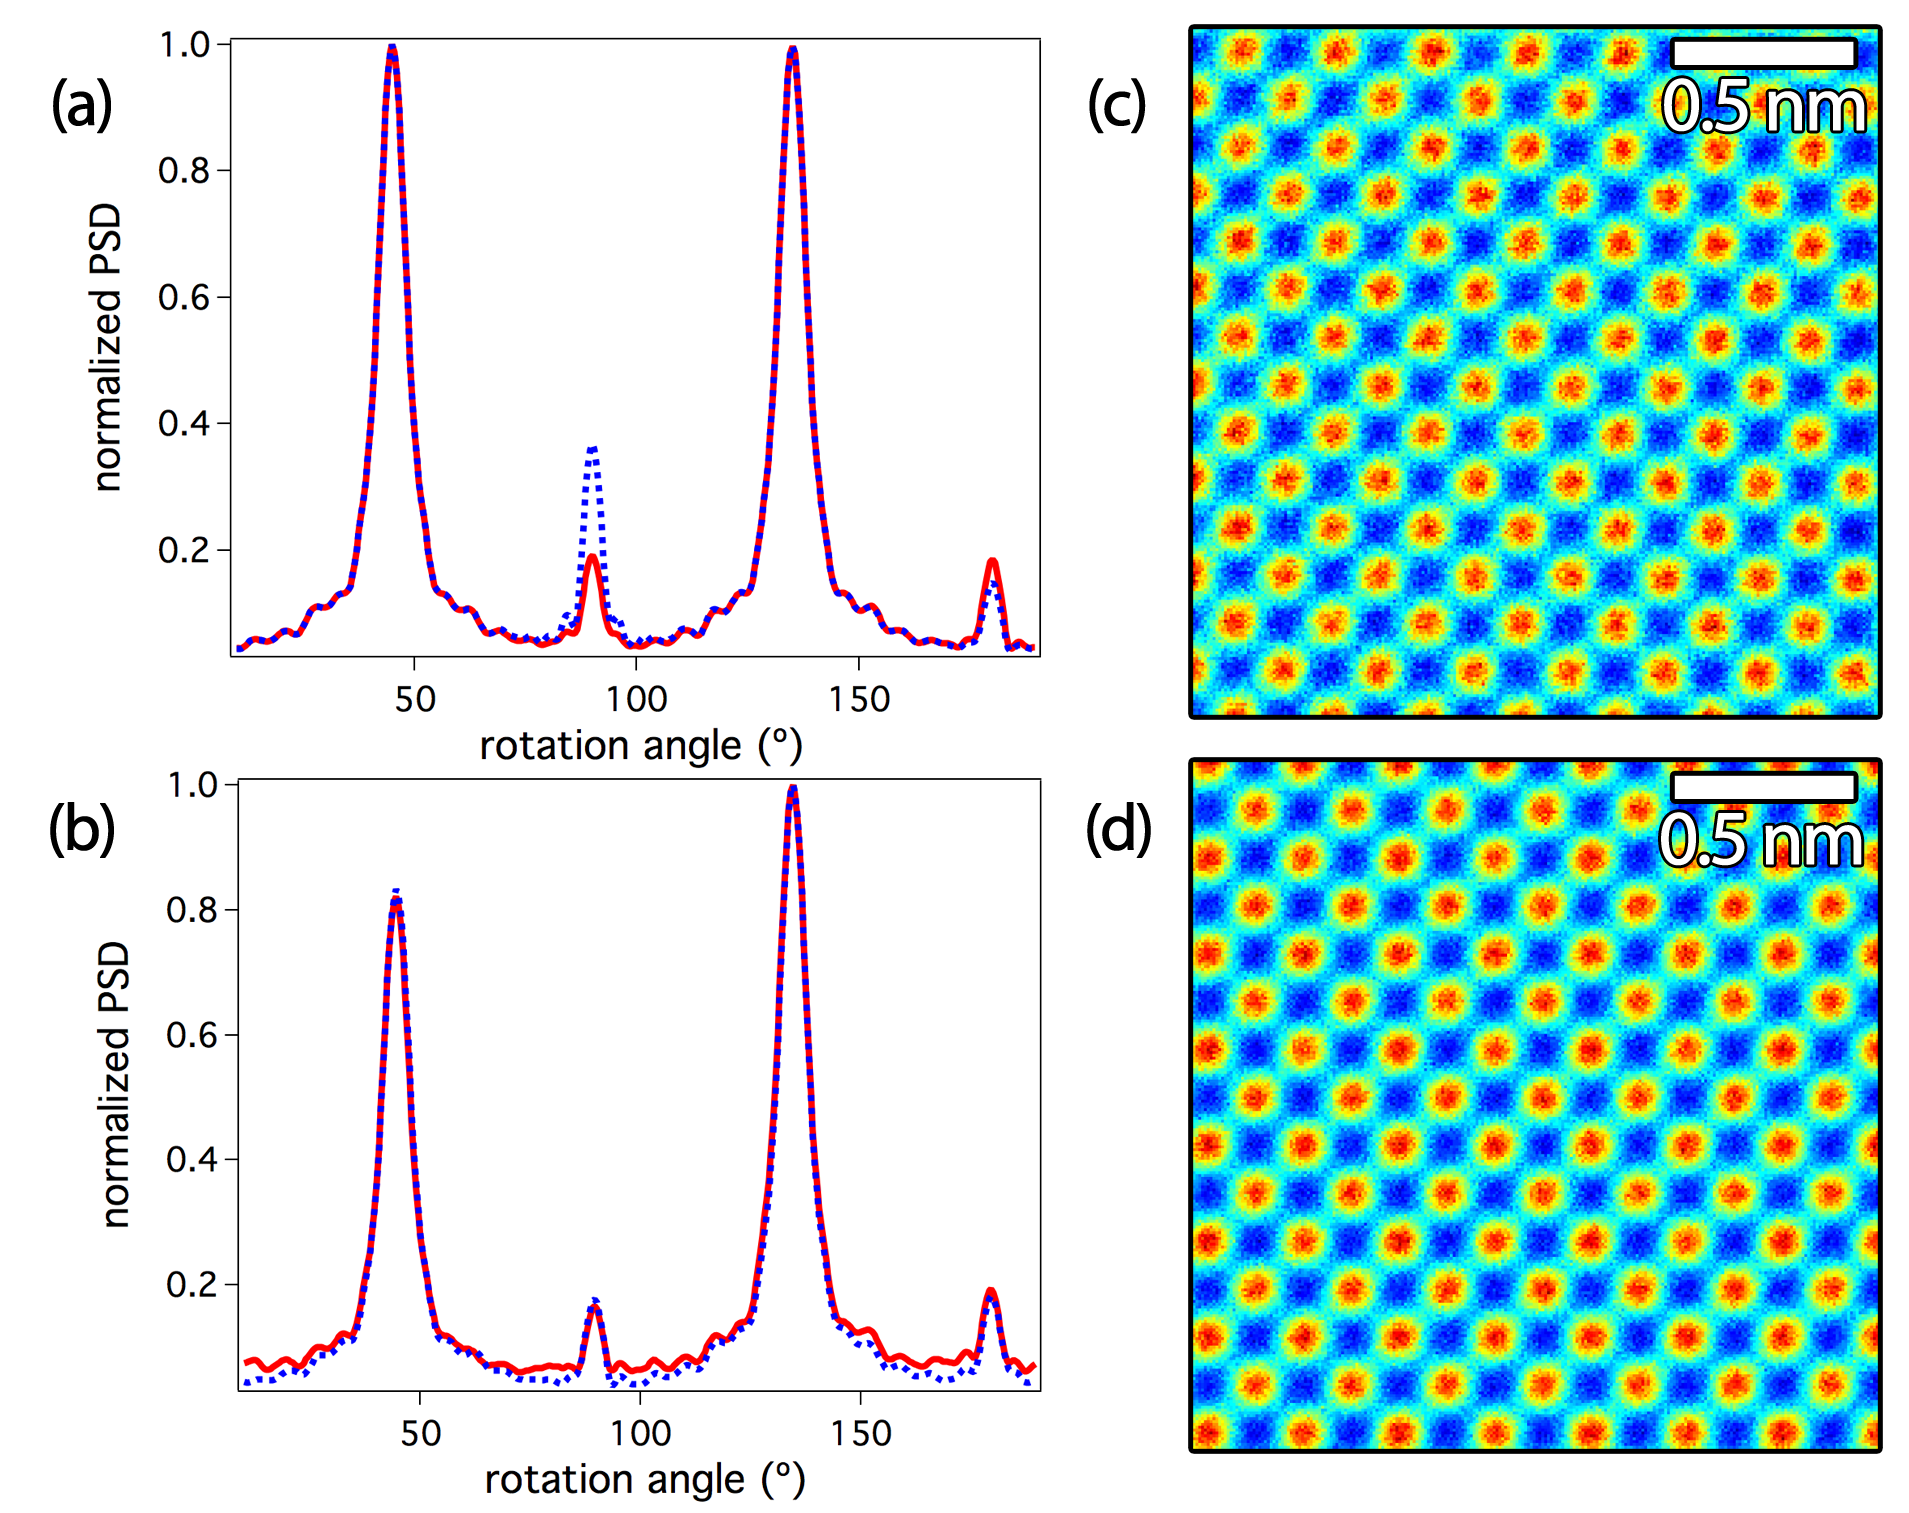
Fig. 2: (a) PSD of simulated Si <100> convolved with symmetric (red) and astigmatic (blue dashed) Gaussian functions. PSD (red trace in (b)) and image of (c) a background noise subtracted RevSTEM Si <100> image and PSD (dashed blue trace in (b)) and image of (d) simulated Si <100> image (noise added to (d)). |