IT-9-O-2884 Orientation measurements in TEM foils using transmission EBSD
For a number of imaging modes in the TEM, knowledge of the orientation is critical. For example dislocation analysis by weak beam dark field imaging requires orienting the grain of interest along one of a limited number of orientations (fig 1). Obtaining this orientation can be done by diffraction pattern analysis of multiple zone-axes. Only when multiple zone axes are identified can it be determined if the zone axes required for the imaging of certain defects are within tilting range. This can be a time consuming process with often limited success, especially on low-symmetry materials. There are a number of automated orientation mapping methods available in the TEM that can assist in this orientation determination [1,2], but the available analysis area in the TEM is limited and it is difficult to obtain a complete overview of a sample.
Combining orientation measurements in the SEM with subsequent TEM analysis can bridge this gap. Standard EBSD measurements can be obtained from most electron transparent crystalline samples that have been prepared for the TEM. Such samples can be mounted in the traditional 70 degree tilt orientation to collect larger area EBSD maps. Recently high resolution EBSD results have also been collected using TEM foils in transmission mode in the SEM (fig 2) [3,4]. But in addition to high resolution orientation mapping, this transmission analysis mode also allows identification of the electron transparent areas in the sample. And in combination with orientation simulations the transmission EBSD orientation results can be used to identify grains that are suitable for specific diffraction analysis on the same sample.
[1] Rauch E. F., Véron M., Portillo J., Bultreys D., Maniette Y., Nicolopoulos S., Automatic Crystal Orientation and Phase Mapping in TEM by Precession Diffraction. Microsc. and Anal. 93 (2008) S5-S8
[2] Dingley, D. J. (2006). "Orientation imaging microscopy for the transmission electron microscope." Microchimica Acta 155(1-2): 19-29
[3] Trimby P.W. Orientation mapping of nanostructured materials using transmission Kikuchi diffraction in the scanning electron microscope. Ultramicroscopy. 2012 Sep;120:16-24.
[4] Suzuki S. Features of Transmission EBSD and its Application. J.Japan Inst. Met. Mater’ Vol.77(2013), p268-275
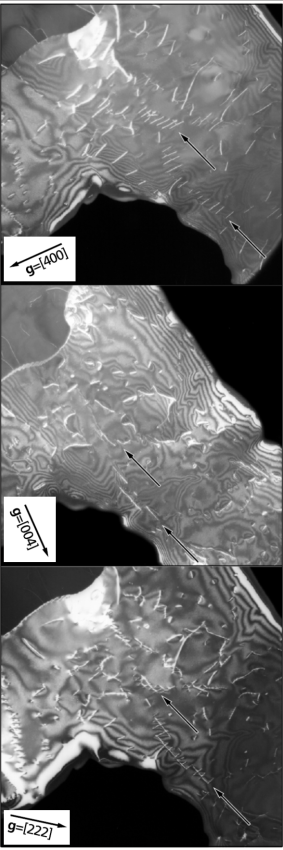
Fig. 1: Weak beam dark field images of a dislocation structure in olivine imaged along different g-vectors |
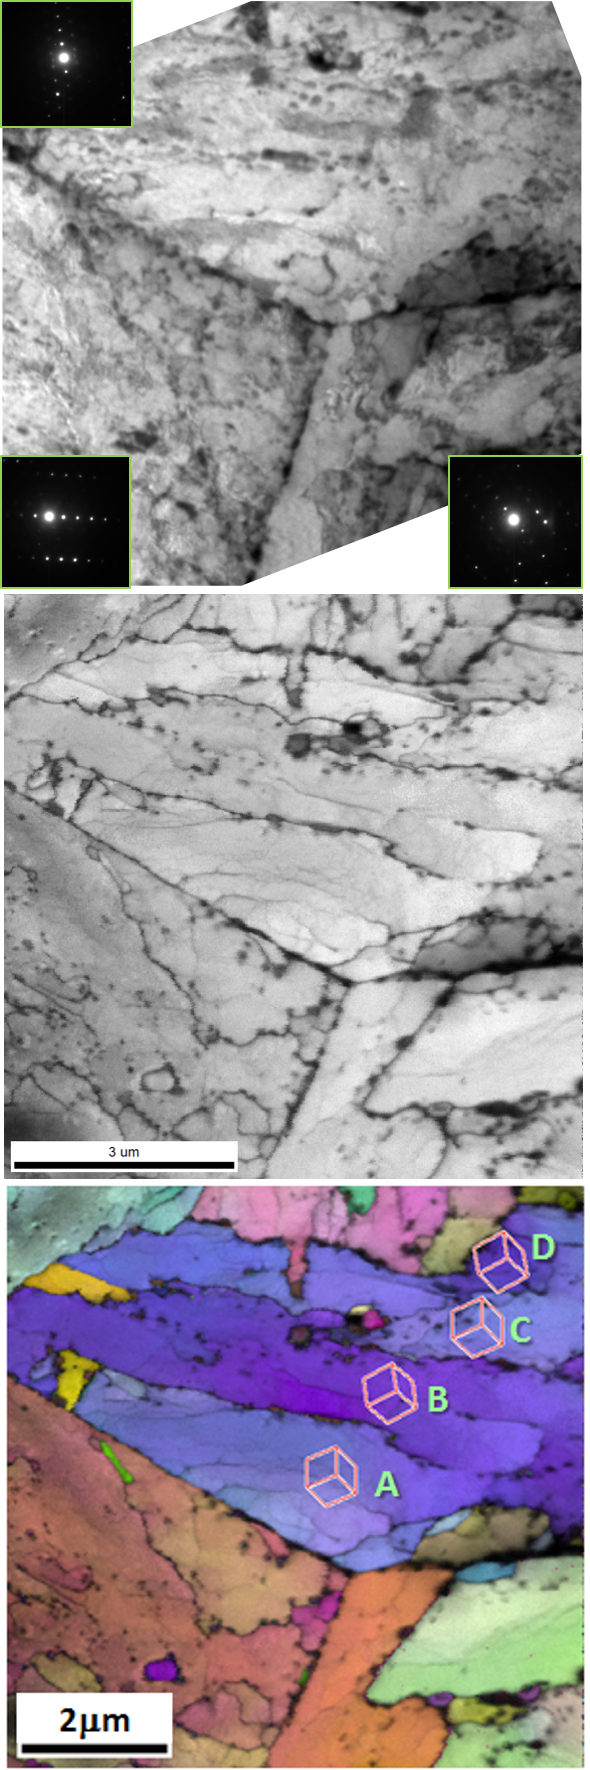
Fig. 2: Images of same area of 8Cr tempered martensite steel specimen. top: TEM bright field image (200kV), middle: t-EBSD IQ map (25kV), bottom: t-EBSD IPF crystal direction map // sample normal. The (sub)grain boundary structure is clearly represented in the t-EBSD images [4]. |