IT-11-O-2781 Towards electron holography of 3D magnetization distributions in nanoscale materials using a model-based iterative reconstruction technique
Electron holography is a powerful technique for recording the phase shift of a high-energy electron wave that has passed through a thin specimen in the transmission electron microscope. The phase shift is, in turn, sensitive to the magnetic field and electrostatic potential in the specimen. Here, we introduce an approach that can be used to reconstruct the three-dimensional magnetization distribution in a magnetic specimen from a series of phase images recorded using electron holography. We generate simulated magnetic induction maps by projecting the three-dimensional magnetization distribution onto a two-dimensional Cartesian grid. We use known analytical solutions for the phase shifts of simple geometrical objects to pre-compute contributions to the phase from individual parts of the grid, in order to simulate phase images of arbitrary three-dimensional objects from any projection direction, with numerical discretization performed in real space to avoid artifacts generated by discretization in Fourier space without a significant increase in computation time. This forward simulation approach is then used in an iterative model-based algorithm to solve the inverse problem of reconstructing the three-dimensional magnetization distribution in the specimen from a tomographic tilt series of two-dimensional phase images. The model-based approach avoids many of the artifacts that result from using classical tomographic techniques such as filtered back-projection, as well as allowing additional constraints and known physical laws to be incorporated.
The authors are grateful to the European Research Council for an Advanced Grant.
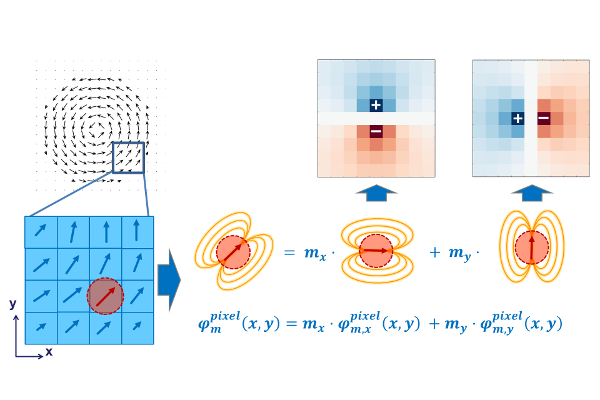
Fig. 1: Illustration of the simulation process: The projected two-dimensional magnetization distribution is sub-divided into pixels which are represented by simple geometries (e.g., a disc). The contribution to the phase shift from every pixel is calculated in the form of two pre-computed components, which are oriented along the axes of the grid. |
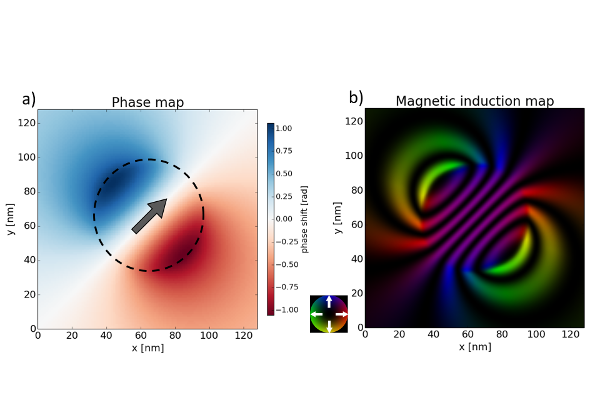
Fig. 2: a) Simulated magnetic phase shift of a uniformly magnetized sphere with a radius of 64 nm in a 128nmx128nmx128nm volume. The magnetization direction is indicated by the arrow. b) Corresponding magnetic induction map (20x phase amplified). The colors represent the direction and magnitude of the phase gradient, according to the color wheel shown. |