IT-6-P-2774 Experimental evaluation of Environmental Scanning Electron Microscopes at high chamber pressure [200 - 4000 Pascal]
Environmental scanning electron microscopy (ESEM) is an established method to investigate uncoated insulators, organic or biological samples in their original state. The presence of the imaging gas inside the specimen chamber is responsible for the secondary electron (SE) detection caused by gas amplification and the generated positive gas ions suppress charging artefacts. Water vapour as imaging gas at high chamber pressure (800 Pascal at 4°C or 2809 Pascal at 23°C) enables the opportunity to investigate wet samples or by varying the pressure or temperature to do wetting experiments [1].
Nevertheless, at high chamber pressures (200 - 4000 Pa) the gas amplification of SEs decreases and the scattering of primary beam electrons inside the imaging gas increases, which degrades the signal to noise ratio (SNR) and prevents image acquisition. Especially for low acceleration voltages, which are typically used for biological samples, the increase in scattering strongly limits the area of applications.
To evaluate the high pressure performance of ESEM and to compare different electron microscopes, information about special resolution and detector type is not enough. The contrast in SE images vanishes at high pressure and the big advantages of elaborated and expensive field emission guns are wasted.
Therefore a key feature for ESEM manufactures and users should be the stagnation gas thickness (additional distance the electron beam travels inside the imaging gas above the pole piece) and the SNR in SE detection for high pressure application, a fact which is not taken into account at the moment [2].
By using a special designed faraday cup, the fraction of scattered and unscattered electrons can be determined and the stagnation gas thickness calculated (see figure 1) [3]. The SNR in SE images can be measured by analysing a single image displaying a copper wire on carbon tape.
Results are presented for different types of SE detectors and beam transfer conditions (see figure 2 and 3). All experiments were performed using a FEI ESEM Quanta 200 or 600 (field emission gun).
1. G.D. Danilatos, 1988. Foundations of Environmental Scanning Electron Microscopy. Adv. Electron Electron Phys. 71, 109–250.
2. G. D. Danilatos, J. Rattenberger, V. Dracopoulos, Journal of Microscopy, (2010), DOI: 10.1111/j.1365-2818.2010.03455.x
3. J. Rattenberger, J. Wagner, H. Schröttner, S. Mitsche, A. Zankel, Scanning 31, (2009), p. 107
The author wants to thank Gerry Danilatos (ESEM Laboratory, Sydney) for helpful discussions and the Austrian Research Promotion Agency (FFG) for financial support (PN 839958).
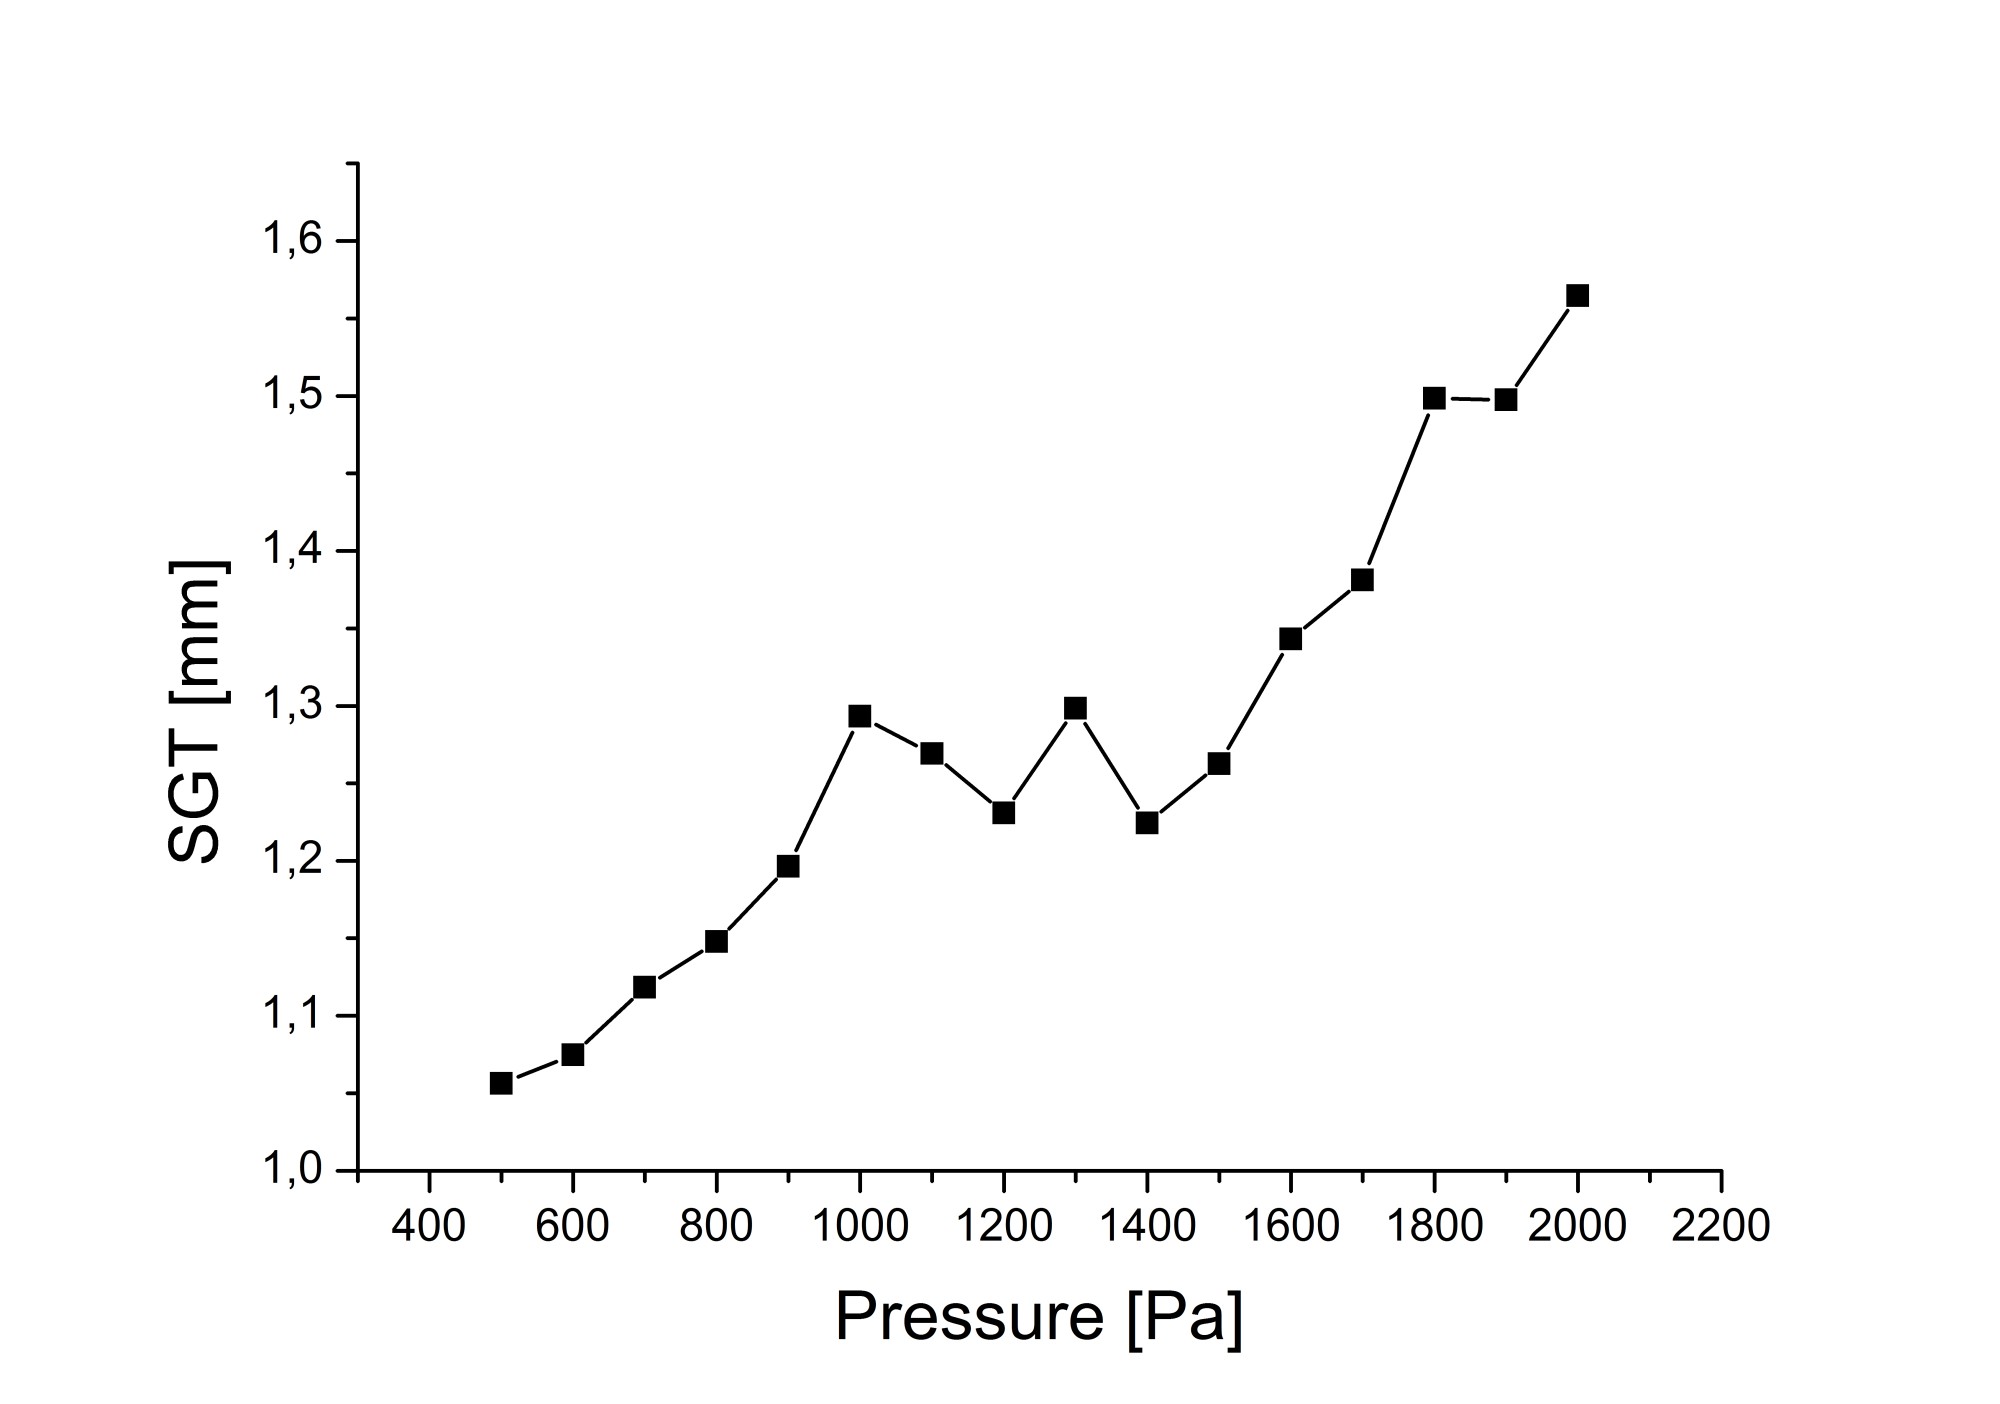
Fig. 1: Stagnation gas thickness (Θ) [mm] as a function of chamber pressure P [Pa] using the gaseous secondary electron detector (GSED) as pressure limiting aperture. |
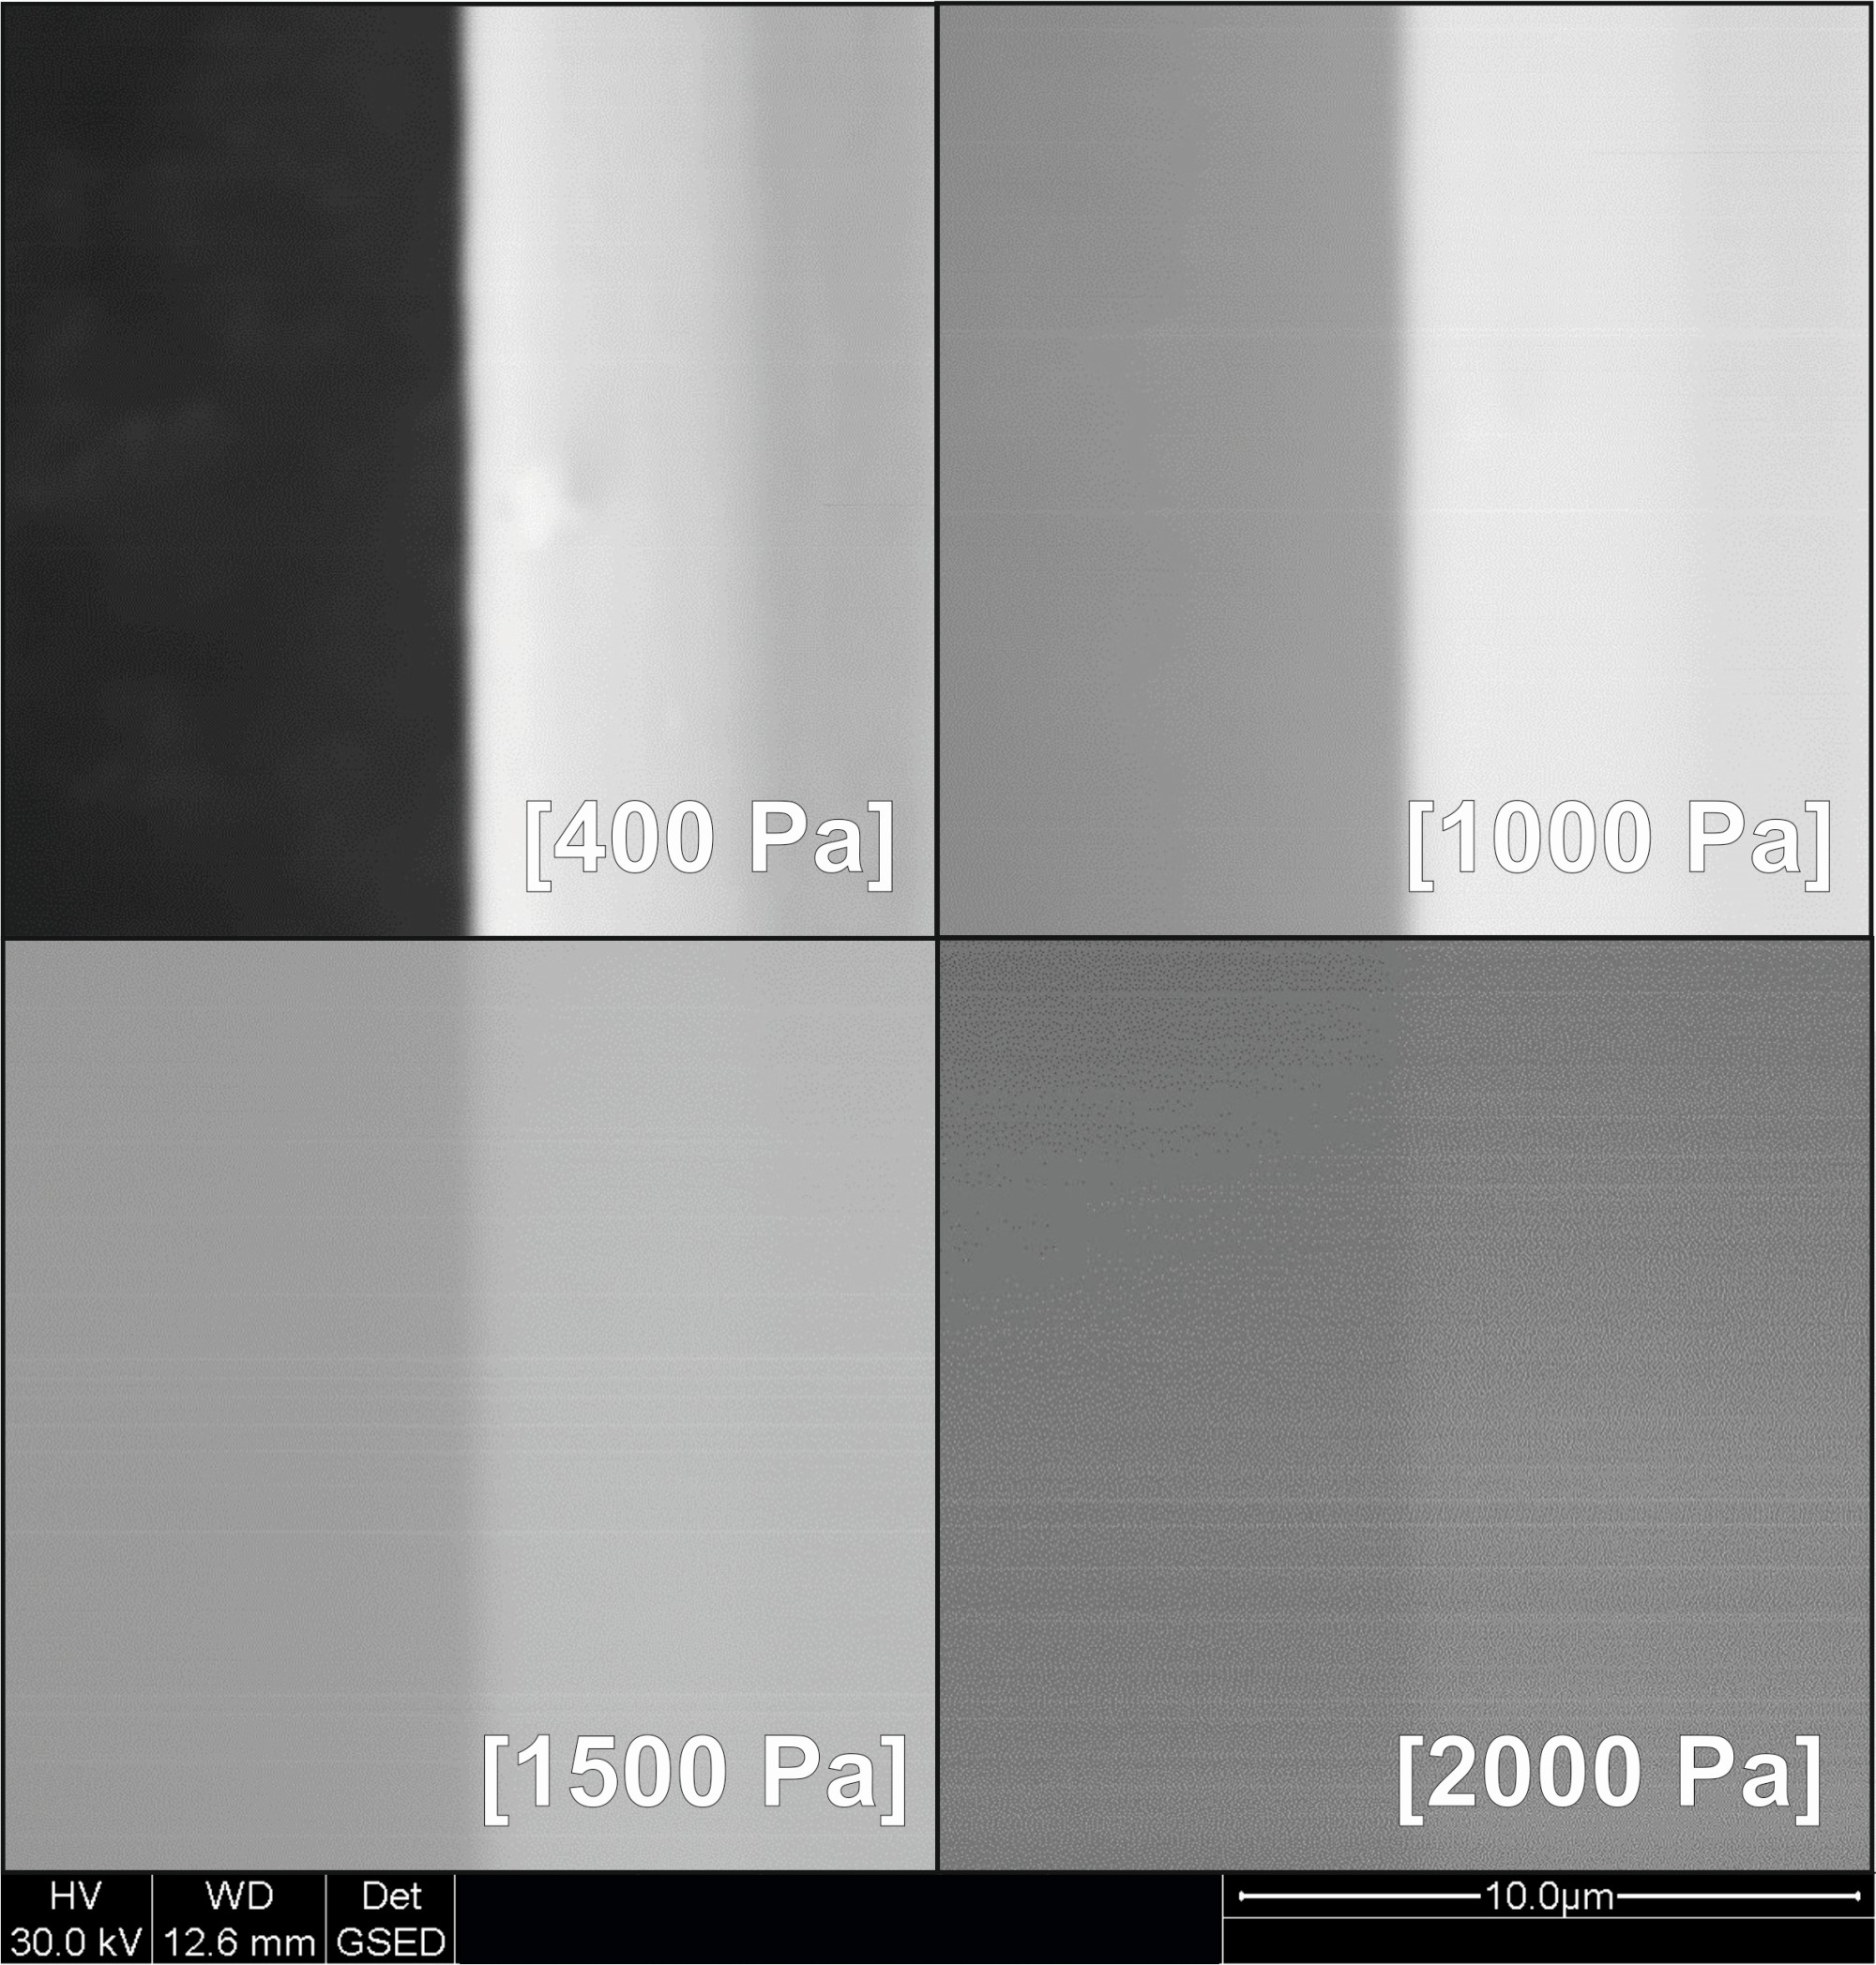
Fig. 2: Test images: copper wire on carbon tape (imaging gas: water vapor) |
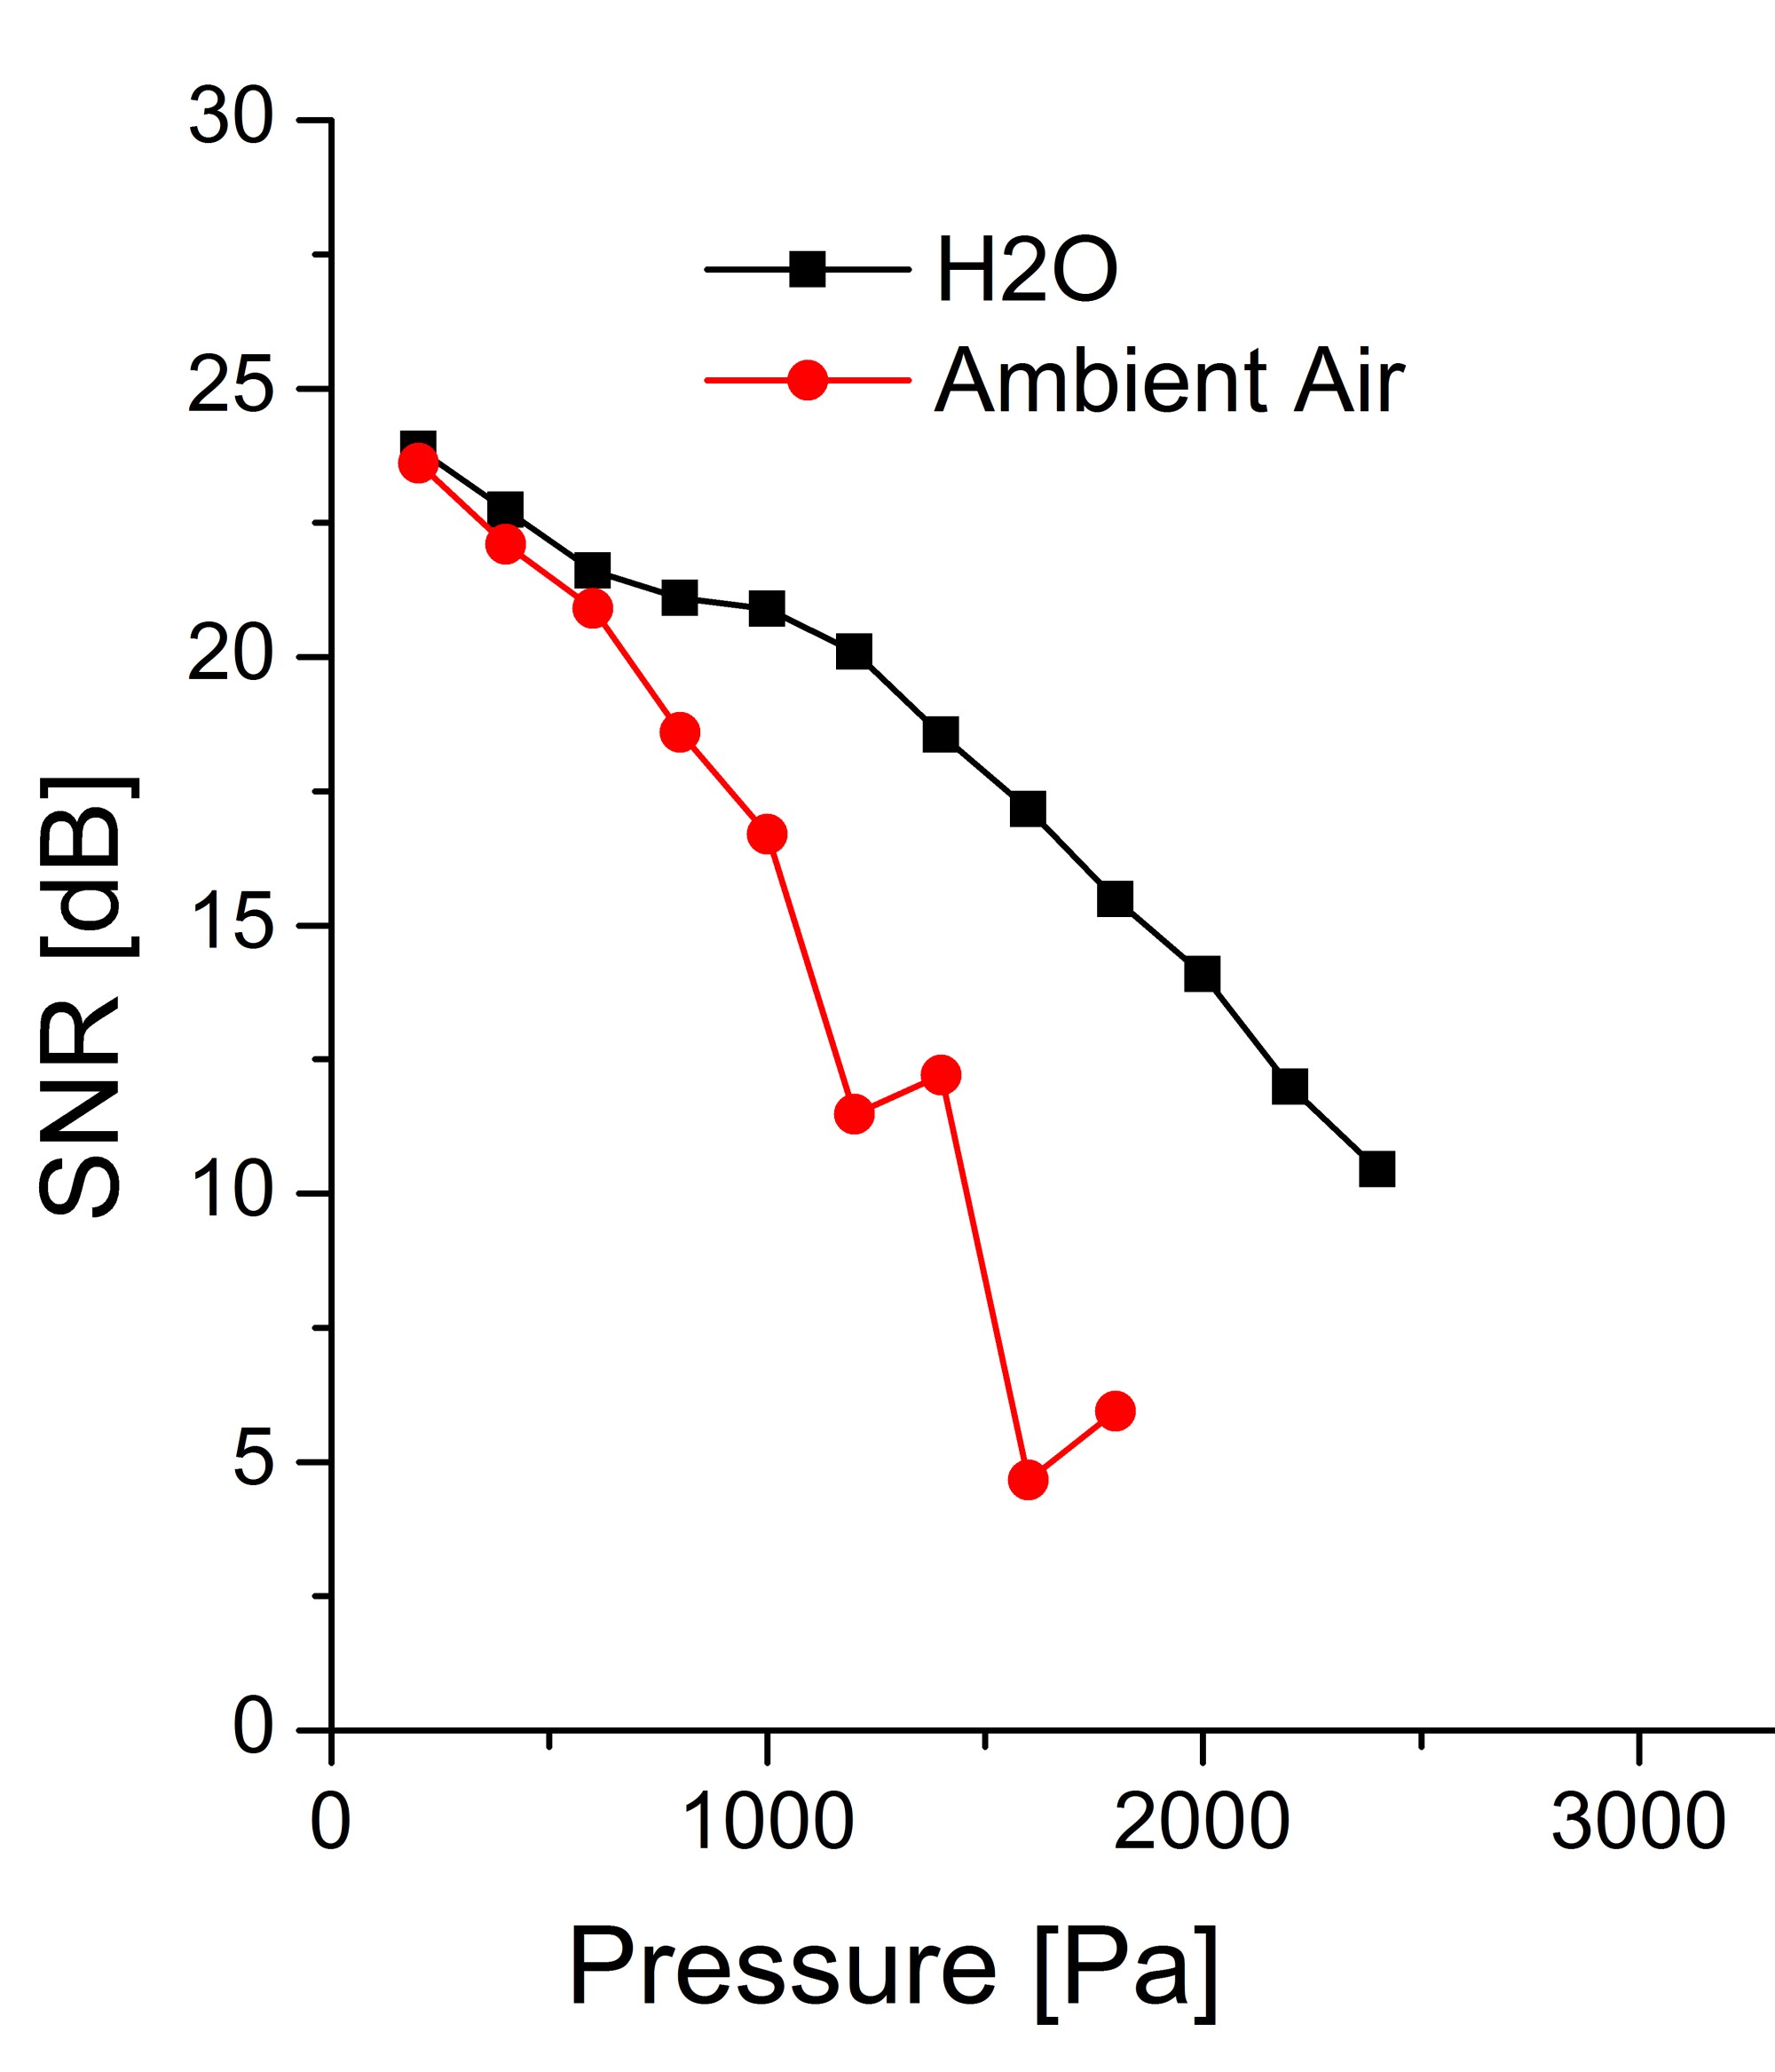
Fig. 3: Signal to noise ration SNR [dB] as a function of chamber pressure [Pa] using the gaseous secondary electron detector (GSED) |
|