IT-5-P-2705 Simultaneous panchromatic and color live cathodoluminescence imaging
Cathodoluminescence (CL) imaging is a standard non-destructive analytical technique. It provides information about composition and crystal structure of the studied material. Scanning electron microscope (SEM) equipped with a CL detection system allows panchromatic, monochromatic or color CL imaging, often in combination with other techniques (EDX, WDX, EBIC…). We can see growing needs for a seamless integration of multiple detection devices into one multi-analytical SEM system. In line with this trend, we have developed a new versatile “two in one” CL detector capable of simultaneous panchromatic and color live imaging.
Figure 1 illustrates the advantage of such simultaneous imaging. It shows a single scan image of a rhyolite sample. In the color image, two types of grains are clearly distinguishable – blue quartz and pinkish topaz. On the other hand, in the panchromatic image the zoning of quartz and topaz grains is more distinct, as the panchromatic channel of the detector collects the signal for the whole spectral range and maintains higher signal to noise ratio.
Versatility of the detector lies in its unique collection optics. Both sub-micrometer high resolution images (see Figure 2) and images with extra large field of view (FOV) can be done. FOV up to 35 mm can be achieved with a single scan, no stage scanning is needed. The collection efficiency of the detector is uniform over the full FOV even when topographic samples are imaged.
The new compact CL detector can be easily integrated into a modular multi-analytical SEM-based system. Simultaneous acquisition of CL together with other signals is straightforward, see Figure 3 for simultaneous CL and BSE. There is no need for complex sample preparation or precise setting of working distance and thus high quality and fast CL analyzes of various samples can be done easily.
The authors acknowledge funding from the European Union Seventh Framework Program [FP7/2007-2013] under grant agreement No. 280566, project UnivSEM.
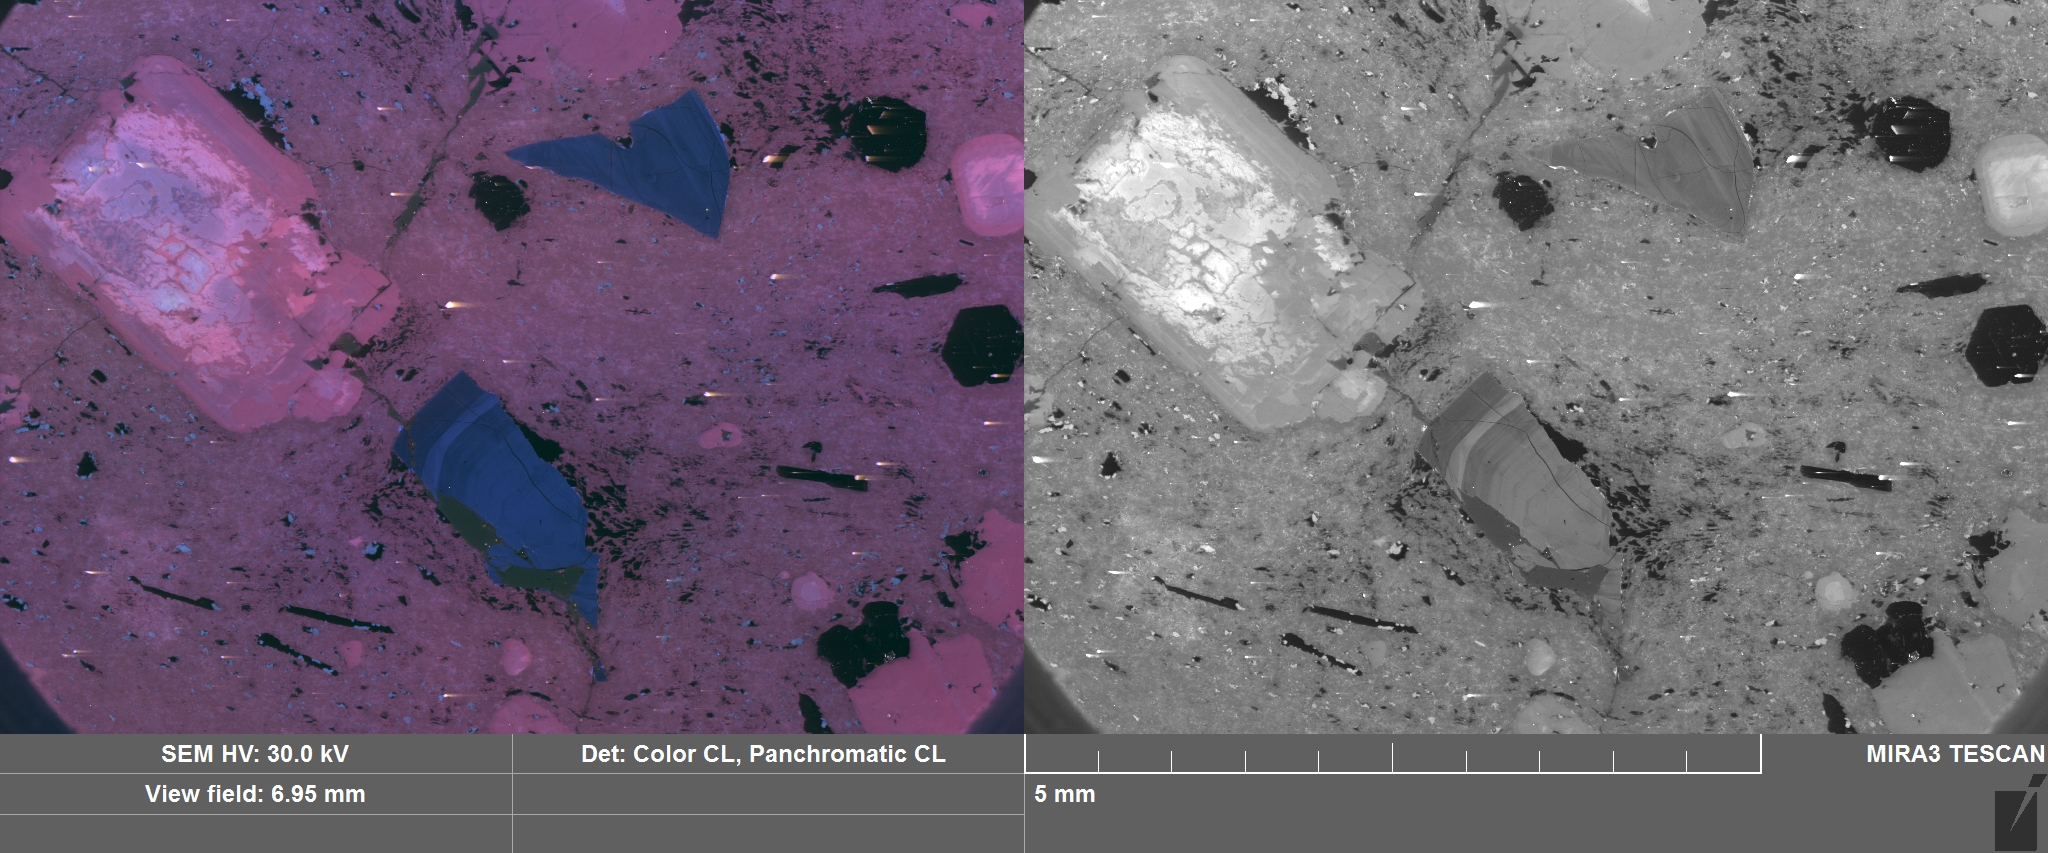
Fig. 1: Color (left) and panchromatic (right) image of a rhyolite sample with quartz (blue) and topaz grains. Zoning typical for volcanic quartz is more contrasting in the panchromatic image. |
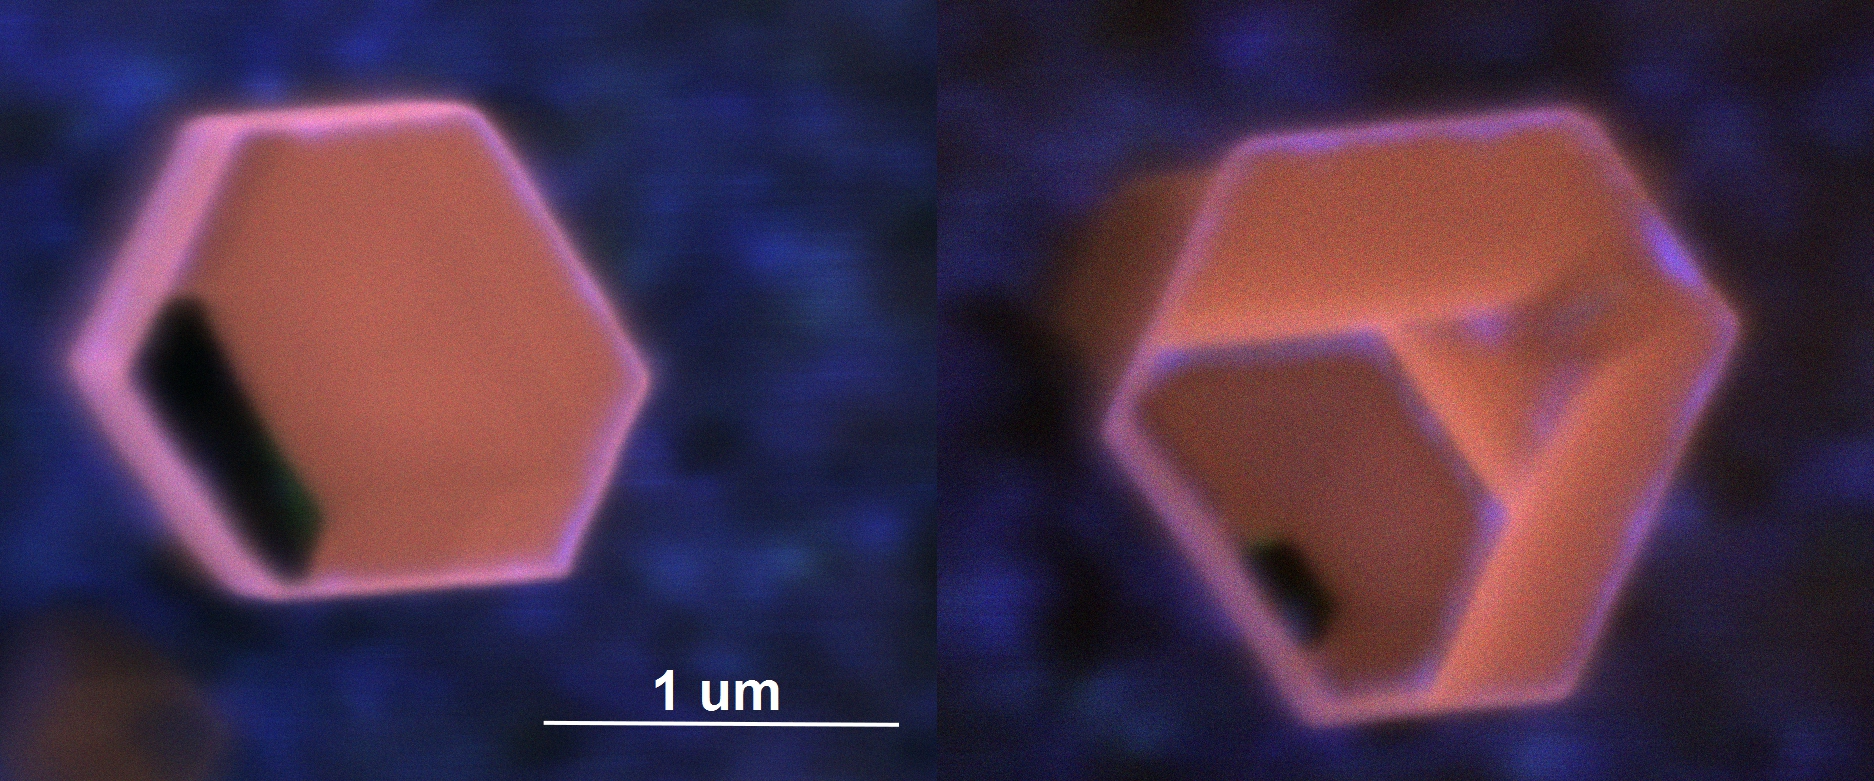
Fig. 2: Sub-micrometer high resolution color image of GaN wires covered with InGaN quantum wells (view from above). Quantum wells (bluish) are deposited close to the sidewall surfaces. Sample courtesy MPI for the Science of Light, Erlangen. |
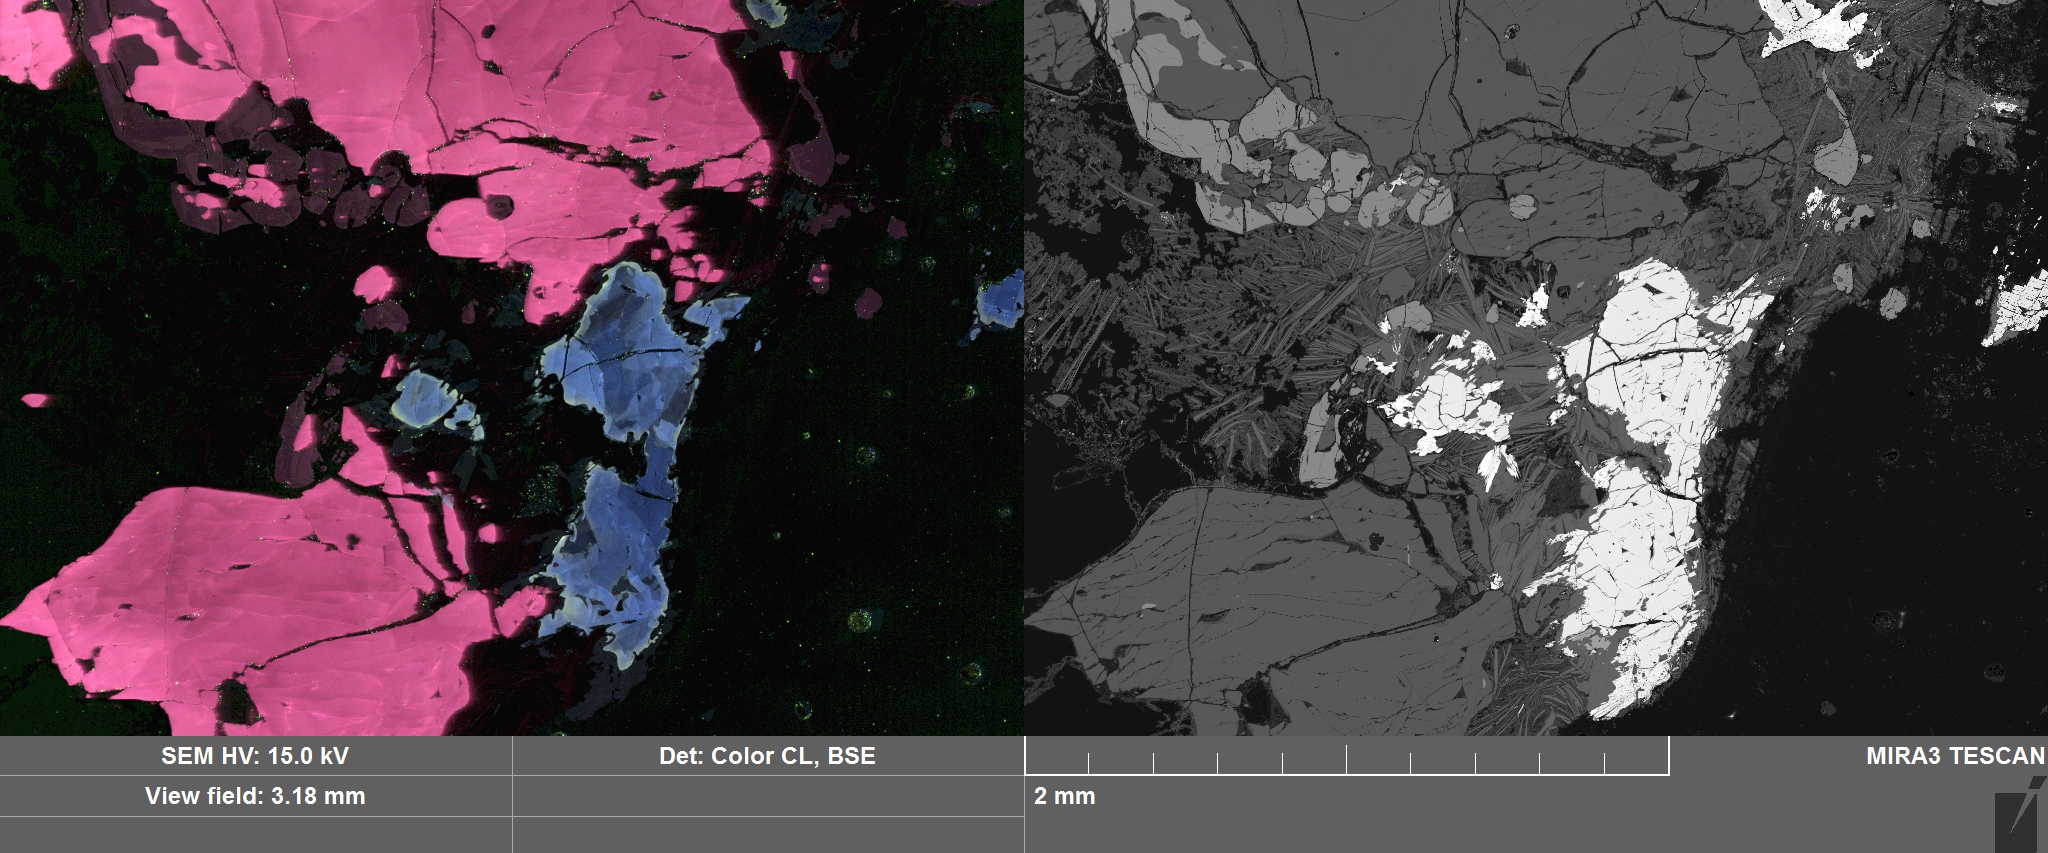
Fig. 3: Color CL (left) and BSE (right) images acquired simultaneously on a ruby containing rock with baddeleyite (blue) grains. |
|