IT-9-P-2650 Fluctuation electron microscopy of an amorphous-crystalline composite material
Fluctuation electron microscopy (FEM) is a TEM technique that allows the characterization of the atomic structure in an amorphous material. It measures the spatial fluctuations in the scattering of electrons arising on a medium-range scale (1-3nm). Here, the FEM technique based on the acquisition of tilted dark-field images was applied to specimens containing nanometer sized crystalline regions embedded in an amorphous matrix.
Intermetallic Co3Ti with the nominal composition of Co-23at.%Ti was made by mixing Co and Ti of high purity in an induction furnace under Ar atmosphere. The high oxidation tendency of Ti leads to the formation of some small titanium-oxide particles. After annealing at 950°C for ~100h under a static Ar overpressure to achieve the L12 long range ordered phase, the crystalline Co3Ti alloy was rendered amorphous by severe plastic deformation using high-pressure torsion (HPT with 20 turns at 8GPa).
Fig. 1a shows a TEM bright-field image of the Co3Ti sample subjected to HPT deformation. Dark dots (5-10nm in size) within a homogeneous speckle contrast characteristic for an amorphous sample indicate the presence of small crystalline particles. Some of these crystalline particles light up in the tilted TEM dark-field image (cf. Fig. 1b) when a certain scattering vector k is used. Fig. 2 shows the corresponding TEM diffraction pattern of a large area. The dominance of the diffuse rings is characteristic for the amorphous phase. The particles can be analysed by EELS but in this study we want to emphasize the capability of FEM. Therefore, FEM that is sensitive to spatial differences in diffraction was applied. Fig. 3 and 4 show the FEM results calculated from tilted TEM dark-field images taken from the entire reciprocal space by varying the direction and length of k. The images were analysed statistically by calculating the mean and the normalized variance V(k) of the image intensity I(k,r): V(k)=(<I(k,r)2>/<I(k,r)>2)-1, where <> means averaging over sample position r [1]. By averaging <I(k)> and V(k) of images taken with a given k, plots of <I(k)> and V(k) as a function of k are obtained (cf. Fig. 3). In order to analyse the crystalline particles, V(k) values of two-phase areas V(k)tp are compared with the value of the amorphous area V(k)a. The plot V(k)tp - V(k)a shows peaks at positions corresponding to titanium-oxide lattice planes (cf. Fig. 4). The good agreement of the results by FEM and EELS reveals that FEM is able to identify crystalline particles and it underlines also the applicability of FEM for the characterisation of structural medium-range order in the amorphous phase.
[1] M.M.J. Treacy et al., J. Phys.: Condens. Matter 19 (2007) 455201.
The authors acknowledge support by the Austrian Science Fund (FWF):[I1309, P22440, J3397] and the National Center for Electron Microscopy, Lawrence Berkeley Lab, which is supported by the U.S. Department of Energy under Contract # DE-AC02-05CH11231.
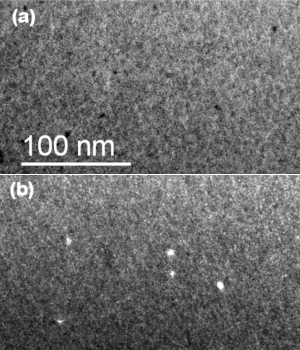
Fig. 1: TEM bright-field (a) and tilted TEM dark-field image (b) of amorphous Co3Ti containing small crystalline particles. |
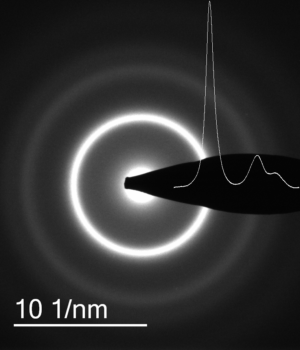
Fig. 2: TEM diffraction pattern and the corresponding intensity profile of amorphous-crystalline Co3Ti. |
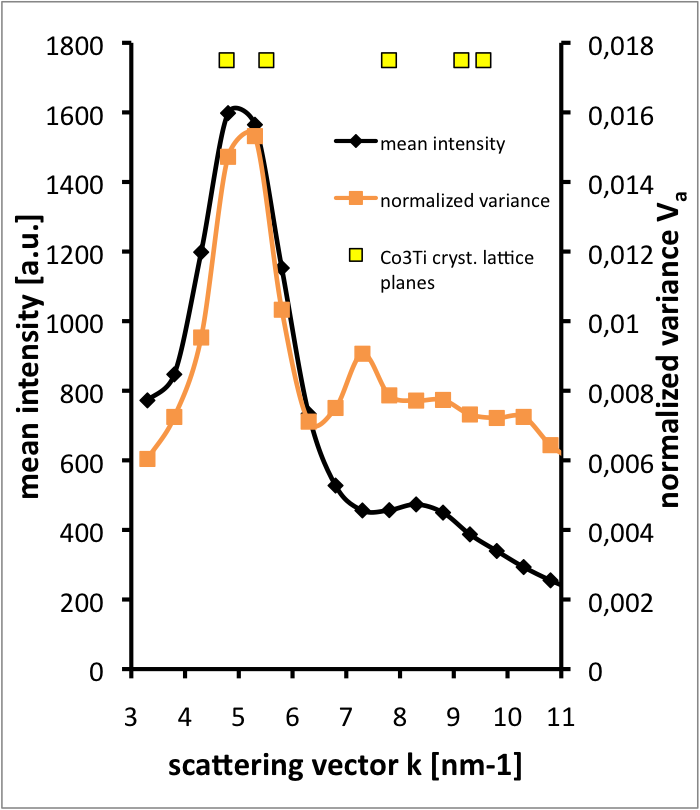
Fig. 3: Plot of the mean intensity and the normalized variance Va of an amorphous area as a function of k. The position of the first peak in Va indicates the presence of Co3Ti-like structure on a medium-range scale. |
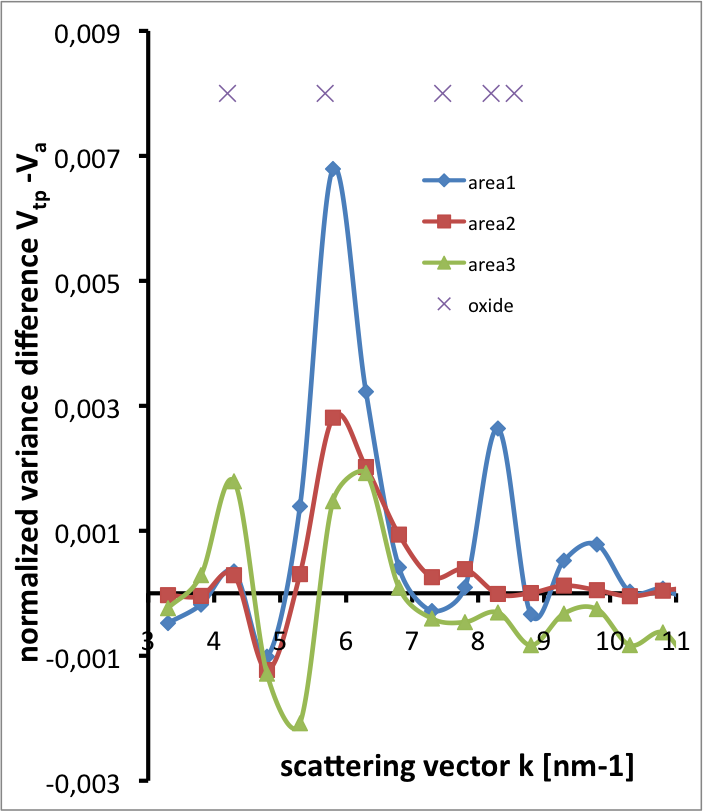
Fig. 4: Plot of the normalized variance Vtp – Va. Depending on the orientation of the oxide particles in the taken area (area1-3) different peak positions corresponding to different lattice planes are observed. |