MS-5-O-2601 TEM and STEM Investigations of SrO-doped Sr(Ti,Nb)O3-δ Thermoelectrics
Sr(Ti1-xNbx)O3-δ solid solutions are promising materials for n-type high-temperature thermoelectrics1. In our study 10 mol% of SrO excess was added to stoichiometric composition with x=0.2 in order to introduce Ruddlesden-Popper (RP) type-planar faults2,3 into the material, thus minimizing thermal conductivity. TEM and STEM were used to study possible ordering and/or distribution of Nb on Ti sites in the perovskite structure. All results were obtained in a Jeol ARM-200F with a CFEG and Cs probe corrector. HAADF imaging was performed at angles from 70 to 175 mrad, while ABF imaging from 11 to 23 mrad. EDXS spectra were acquired using JEOL Centurio Dry SD100GV SDD Detector.
RP planar faults, as viewed along [001] zone axis, are shown in HRTEM micrograph in figure 1. The commonly observed number of perovskite unit cells between the planar faults is >2, which corresponds to various homologous compounds with the formula Srn+1(Ti,Nb)nO3n+1. However, solid solution Sr(Ti,Nb)O3-type grains with no RP faults can also be observed (bottom inset in Fig. 1). A HR HAADF STEM image of ordered RP faults (Fig. 2) shows that while the measured intensities of individual Sr atomic columns along a single fault do not scatter significantly, the (Ti,Nb)O atom columns exhibit quite large differences in measured intensities, thus indicating significant variation in Nb and Ti content within a single atom column. Quantitative analysis of measured intensities is in progress. The comparison between simultaneously acquired HAADF and ABF images of a single RP fault is shown in figure 3. While pure oxygen atomic columns cannot be resolved in the HAADF image, they can be readily observed using ABF imaging. The positions of oxygen atom columns along the planar faults are in full agreement with the structural model of a RP planar fault. Additional information on Nb distribution within perovskite matrix/RP faults was obtained by EDXS. While low magnification EDXS mappings show enrichment of Sr at RP faults accompanied by a corresponding decrease in Ti and Nb content, atom-resolved EDXS mappings confirm that individual mixed (Ti,Nb)O atom columns contain different Nb content (annotated atom column). Additionally, the spot EDXS line analysis (net counts) again shows much larger scatter in accumulated net counts for Ti as compared with Sr. The results being presented clearly show that no Nb is incorporated into the SrO RP faults and that the Nb is inhomogeneously incorporated within (Ti,Nb)O atom columns.
References
1. S. Ohta et al., App.Phy.Lett., 2005, vol. 87, p. 092108.
2. S.N. Ruddlesden, P. Popper, Acta cryst., 1958, vol. 11, p. 54 -55.
3. S. Sturm et al, J. Mater. Res., 2009, Vol. 24, No.8, p. 2596-2604.
The authors acknowledge financial support from the Scientific and Technological Research Council of Turkey (TÜBITAK) under Fellows Program and from EU under Seventh Framework Programme under grant agreement n°312483 (ESTEEM2).
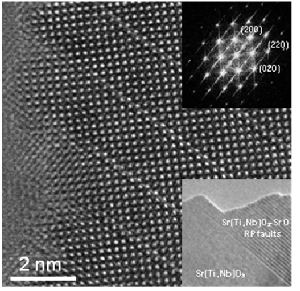
Fig. 1: HRTEM micrograph of RP faults as seen in the [001] zone axis with the corresponding diffraction pattern. The lower inset shows coexistence of Sr(Ti,Nb)O3 grains with grains containing RP faults. |

Fig. 2: HR HAADF STEM micrograph of ordered RP faults. Sr and mixed (Ti,Nb)O atomic columns are clearly distinguished due to different intensities. Large scatter in measured intensities of (Ti,Nb)O atom columns is observed. |
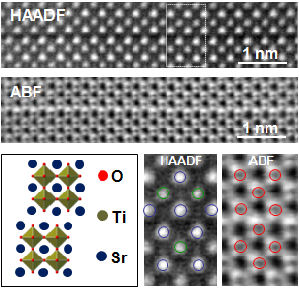
Fig. 3: HR HAADF and ABF STEM micrographs of a single RP fault. The positions of oxygen atomic columns in APB micrograph are clearly resolved at the faults as well as within the perovskite matrix viewed along the [001] zone axis. |

Fig. 4: Low magnification and atom resolved EDXS mappings of RP fault(s). The latter clearly shows atom columns with different Ti and Nb content (marked). Zig-zag pattern of Sr atom columns at the fault is also resolved. EDXS line analysis is showing large scatter in Ti Kα net counts across perovskite matrix. |