IT-2-O-2538 Optimizing Phase Contrast Imaging in Aberration Corrected TEM
Since the realization of the first aberration corrected TEM [1], the number of corrected TEMs is still rapidly growing. Two key benefits are boosting the tremendous success of spherical aberration correction: vanishing delocalization and improved point resolution limit. The latter is achieved by using CS=C3 as additional optimization parameter to increase the aperture radius where the phase shift distribution (phase plate) of the elastically scattered electrons stays close to the optimum of +π/2 or −π/2 for dark or bright atom contrast, respectively. Various efforts have been made to optimize the phase plate, e.g. [2, 3], employing different measures for the distance of real and ideal phase plate as criterion for optimization. However, the different criteria lead to similar results.
Many users still use a π/4-limit for each aberration coefficient separately to assess the corrected state. However, advanced criteria such as minimizing the integrated mean quadratic deviation [3] or minimizing the largest deviation from the ideal phase over the aperture are much more sensible. While designing the SALVE II corrector [5] we used the latter criterion for optimizing the phase plate to assess imaging quality.
Fig. 1 shows the phase shifts generated by all axial aberration coefficients up to fifth order. Compensation schemes can be applied for aberrations of same multiplicity but different orders. In Fig. 1 potential partners are arranged within one column. The highest-order coefficient and the aperture size determine the optimum values for the lower-order coefficients (e.g. multiplicity 2: S5 given by corrector design; S3, A1 optimized during alignment). The procedure for optimizing coefficients of non-zero multiplicity is similar to optimize C3 and defocus C1 for a given C5, except that the deviation from zero instead of +π/2 or −π/2 is minimized.
The performance of the SALVE II corrector for 40 kV is shown in Fig. 2. The phase plate (a) corresponds to the output of the CEOS software after aberration correction. The π/4-circle is misleadingly small as it is largely determined by C3. In image (b) only the sum of all non-round contributions is shown. Optimizing C1 for given C3 and C5 yields passband (c). Only with a full compensation scheme (d, e) for all fourth- and fifth-order aberrations using all adjustable lower order aberrations, a passband of up to 50 mrad can be achieved.
References:
[1] M. Haider et al, Nature 392 (1998), 768-769.
[2] O. Scherzer, Ber. Bunsen-Gesellschaft phys. Chemie 74 (1970), 1154-1167.
[3] M. Lentzen, Microsc. Microanal. 14 (2008), 16-26.
[4] M. Born, E. Wolf, Principles of Optics, 6th edition (Cambridge university press, Cambridge), p. 468.
[5] SALVE II project, <http://www.salve-project.de>.
none
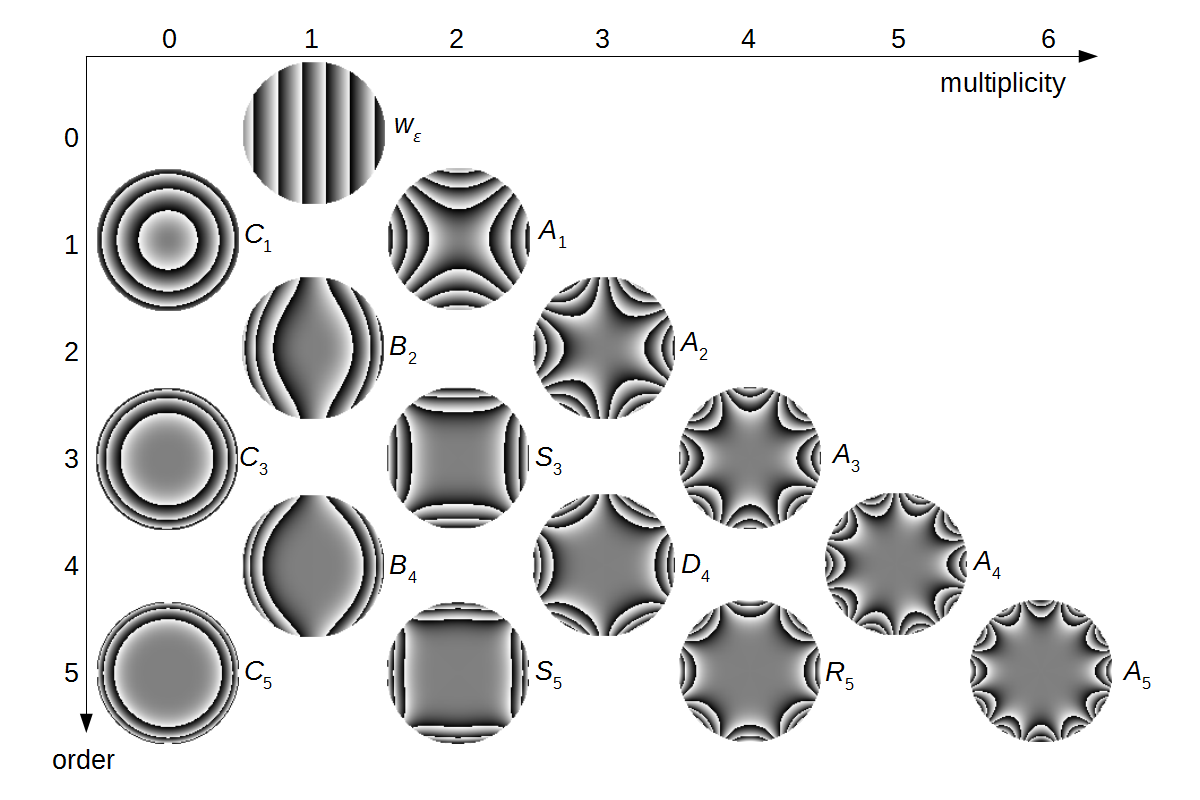
Fig. 1: Table of axial aberrations visualized as phase plates. At the aperture edge ±6π is adopted; the phase is wrapped to [-π (black); π (white)[. Aberrations of same multiplicity but different order can partly compensate each other. |
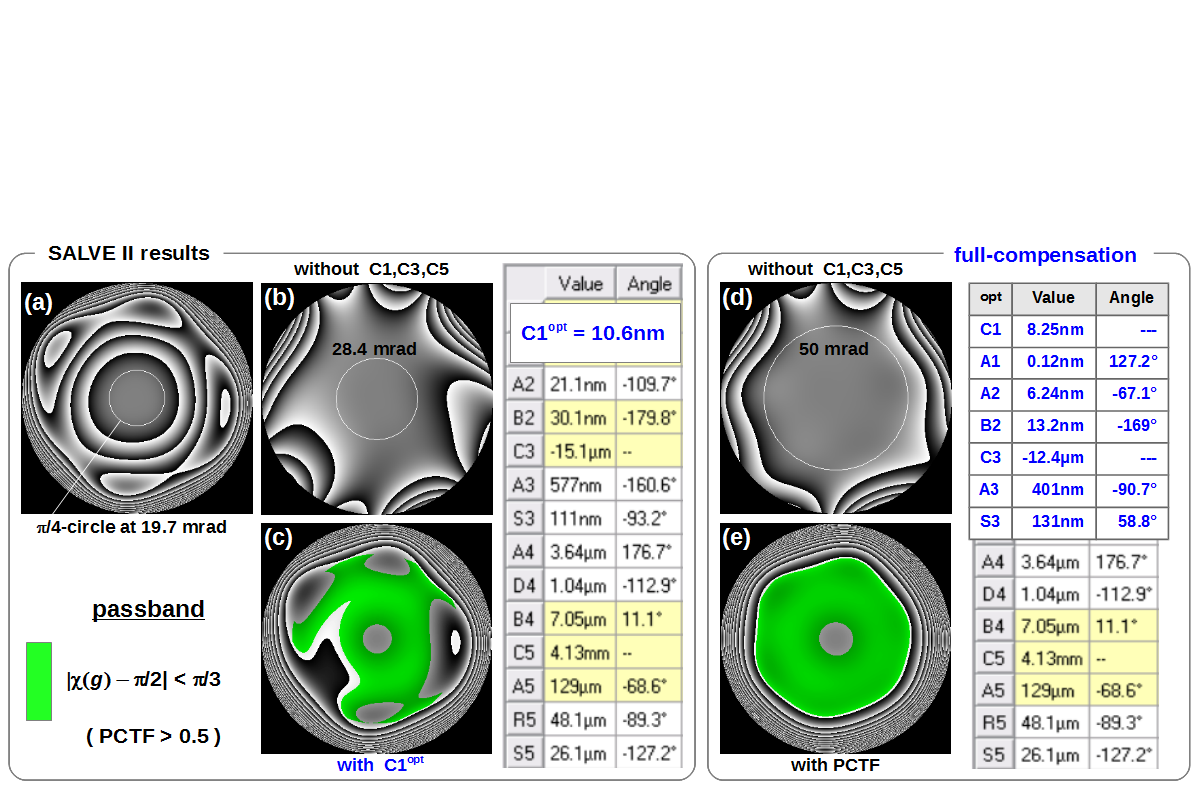
Fig. 2: Left: Phase plates for measured aberration coefficients at the SALVE II microscope operated at 40 kV. The passband in (c) demonstrates the reduced contrast transfer due to non-round residual aberrations. Right: With a suitable compensation scheme a passband up to 50 mrad can be achieved. The aperture radius of all phase plates is 75 mrad. |