IT-5-O-2490 Single Eu atom M shell spectroscopy and X-ray fluorescence yield
Europium (Eu) has a half filled 4f shell and two valences (2+, 3+). The transition between these is induced by pressure or oxidation. We report single atom EELS and EDX spectroscopy of Eu M shell. This shell is ideal for such experiments as its energy falls in a range where EELS and EDX are feasible. Atomically resolved EELS experiments were performed in the JEOL-CREST double corrected microscope operated at 60 kV. EDX-EELS experiments have been performed in an ARM-JEOL 200 operated at 60 kV, equipped with a Centurio-JEOL silicon drifted detector (SDD, 0.80 sr collection angle).
Eu double atomic chains confined inside carbon nanotubes (Figure 1a) have been studied. EELS analysis shows that all chains contain 2+ atoms. The crystal structure is related to that of bulk Eu hcp.
Firstly, Eu M edge EELS analysis (spectrum in Figure 1d) demonstrates the possibility of measuring the spectral signature of single Eu atoms and possibly their valence. HAADF (Figure 1b) and EELS (Figure 1c) intensity maps show the atomic positions and the measured signal.
To compare the absorption and emission of single atoms (Figure 2) EDX and EELS spectrum images have been acquired. Figure 2 shows the maps of the HAADF, EELS M edge and EDX M lines (Figure 2a-c). Atomic positions can only be distinguished in the first two due to the low signal level for the EDX. Profiles along the second atomic pair (arrow in Figure 2a) are shown in Figure 2d. The M and the L emission lines and the M edge absorption signal have been measured. The M EDX and M EELS spectra for one atom are shown in Figure 2e and 2f (equivalent to 12.5 s exposure), respectively. An average EDX spectrum (198 s exposure) is shown in Figure 2g.
We have estimated the total X-ray emission and absorption events (red square on Figure 2b). The absorption signal has been corrected for the CCD efficiency and the finite convergence and collection angles. Events not counted due to the finite energy integration window (100 eV) have been estimated using power laws (largest source of uncertainty). The X-ray signal was corrected by a geometric factor due to the detector’s solid angle. The creation of M-shell vacancies due to L shell transitions was estimated from the EDX signal. Coster-Kronig M sub-shell transitions were not considered. Estimated fluorescence yield lies between 0.02 and 0.03 (the theoretical value is 0.0136). The uncertainty stems from the necessity to extrapolate the tail of the M edge.
This work is partially supported by a JST Research Acceleration programme. The authors would like to thank Niimi Yoshiko for her assistance during initial experiments.
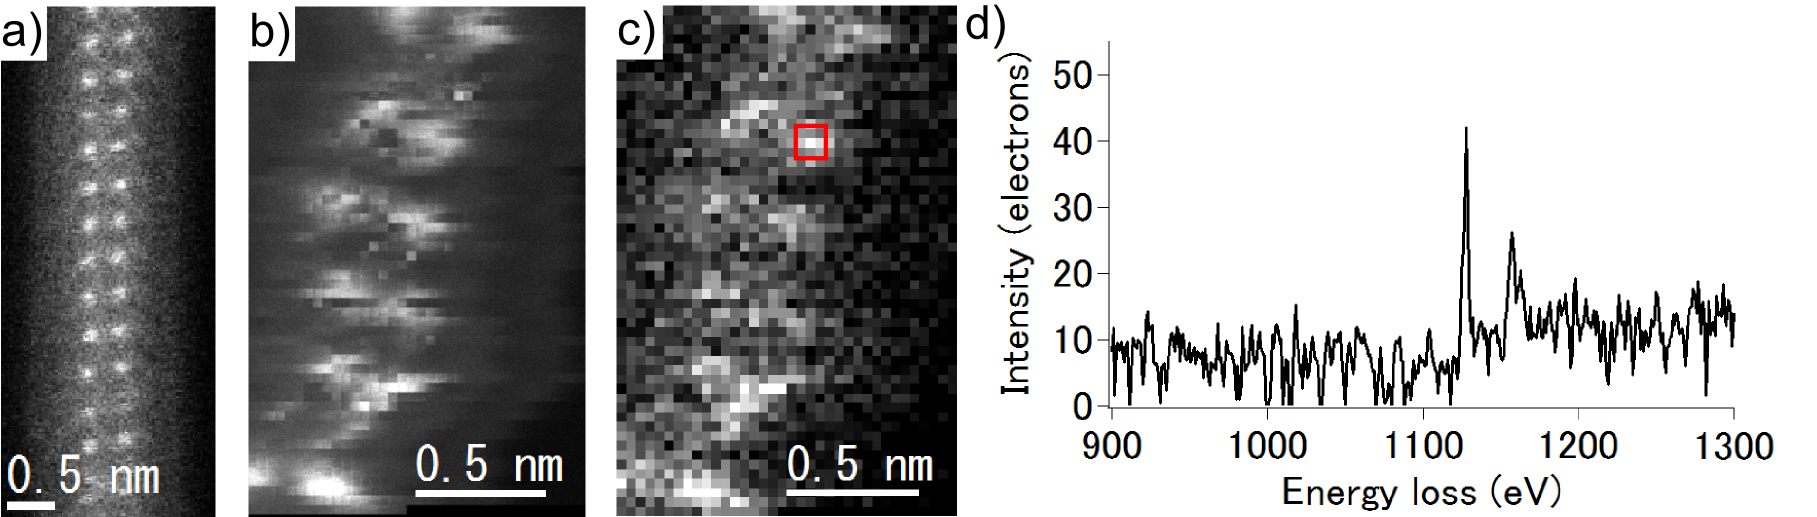
Fig. 1: a) HAADF image of a double Eu chain. b-c) HAADF and integrated M intensity (100 eV window) of a double Eu chain. d) Spectrum from one atom integrated on the red square in b (total exposure time 9x50 = 450 ms). The inset shows the signal after background subtraction. |
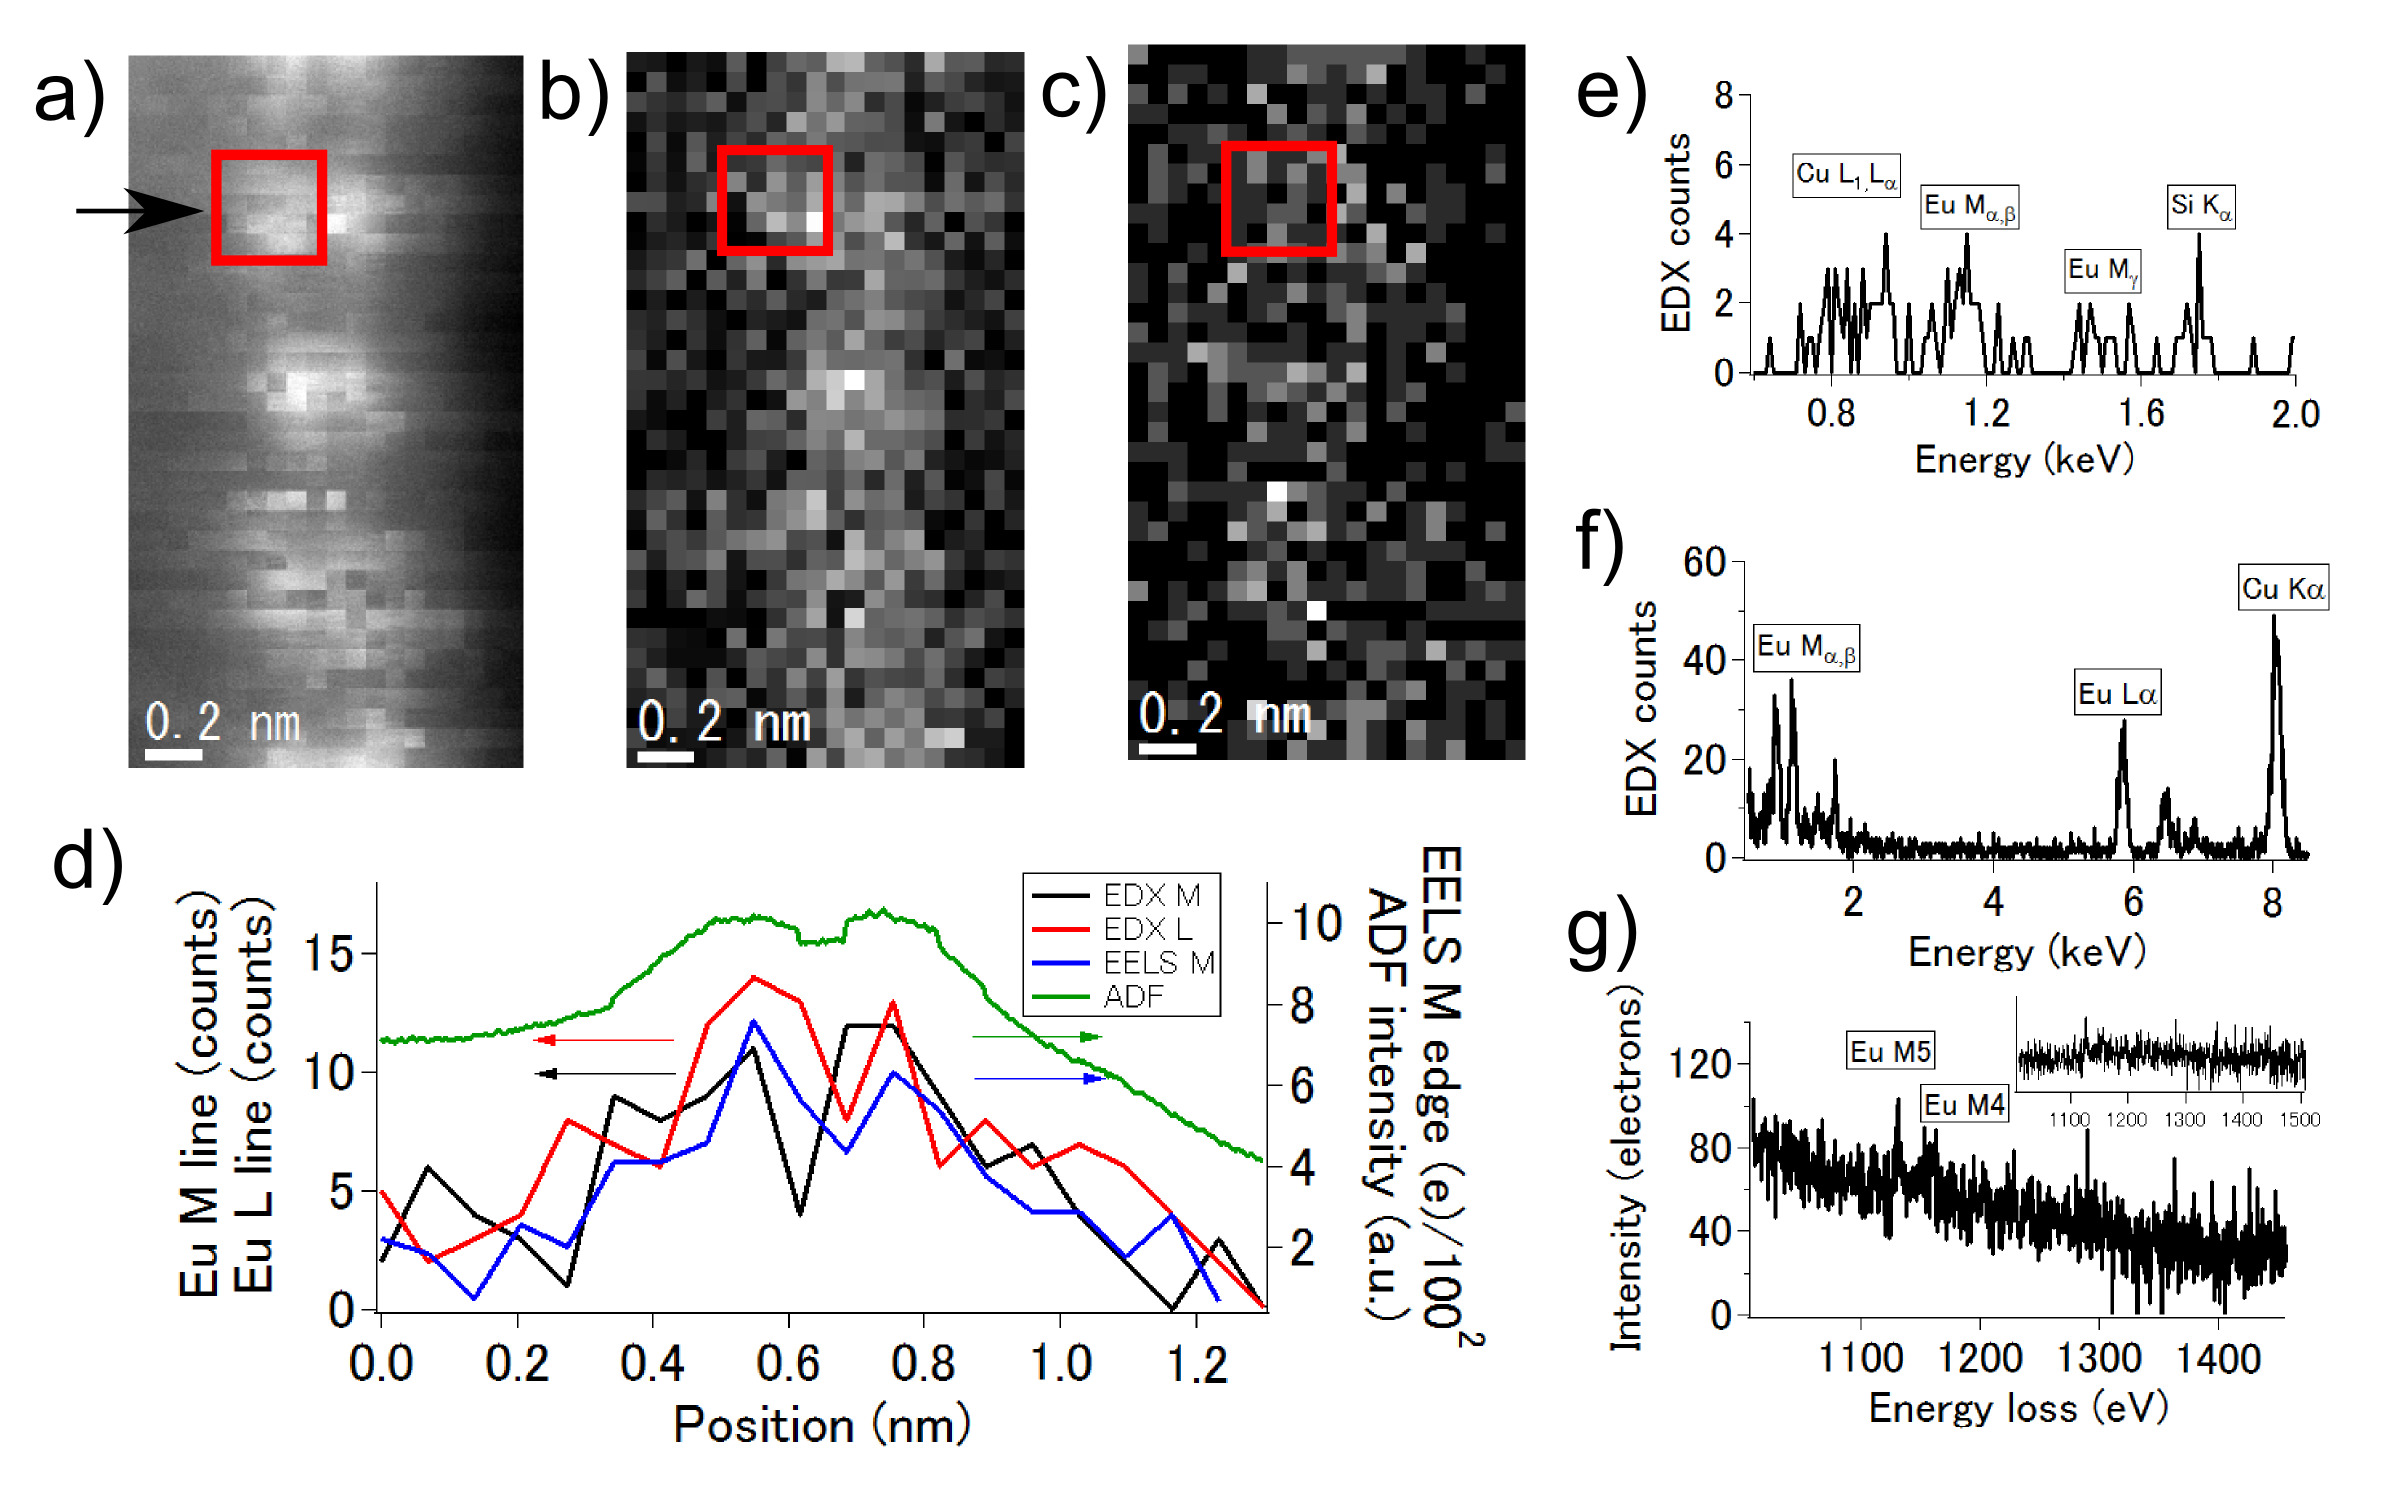
Fig. 2: a-c) HAADF, M edge EELS and M line EDX for a double Eu chain, respectively. d) Profiles of the Eu M and L EDX, M edge EELS and HAADF signals along the arrow in a). e-g) Single atom EDX and EELS spectra, respectively. f) Average EDX signal in the spectrum image. The exposure time was 198s. Not all peaks are marked but all are identified. |