IT-13-P-2440 Channeling contrast: a cost effective alternative to EBSD orientation mapping in scanning focused probe instruments (SEM/FIB) ?
Generally, for grains at the micron scale, orientation maps are obtained by Electron Back Scattered Diffraction (EBSD) in a Scanning Electron Microscope (SEM). For various reasons, orientation maps with the EBSD technique can be challenging: material properties (conductive or not, preparation problems), geometrical setup (impossibility to collect the signal), pseudo-symmetry Kikuchi diffraction patterns, nano-sized structures, large area mapping, etc. In this context, it is worth investigating other means to map the crystallographic orientations of grain.
Channeling contrast is a well-known phenomenon allowing grains of a polycrystalline sample to be distinguished, even if only one phase is present. Depending on the orientation of the crystallographic planes, the secondary and backscattered electron yields vary from one grain to the other, resulting in different intensities received by the detectors. For this reason, the contrast of each grain varies when the orientation of the sample is changed [3].
We show in this study how it is possible to use this channeling effect (with an electron or an ion beam) to obtain the three Euler angles characterizing the orientation at a given point of the sample surface. The main concept is to obtain an intensity profile at that point, to compare the intensity profile to a semi-empirical database of profiles and to find the best fit, i.e. the three Euler angles associated with this point. Comparing with EBSD measurements on the same area allowed us to determine the precision of the indexation, which is better than 5°. We discuss then the best way to obtain an intensity series, either by tilting or rotating the sample, with regards to acquisition stability and unicity of the indexation. The issue of acquisition time is also discussed, and an example of our indexation method based on a 30 sec movie over 360° is shown. We conclude by evaluating the pros and cons of using ions or electrons for such indexation purposes.
[1] Estimation of recrystallized volume fraction from EBSD data, J. Tarasiuk, Ph. Gerber and B. Bacroix, Acta Materialia (2002) 50 1467–1477
[2] Characterization of the Grain-Boundary Character and Energy Distributions of Yttria Using Automated Serial Sectioning and EBSD in the FIB, S.J. Dillon and G.S. Rohrer, J. Am. Ceram. Soc. (2009) 92 1580–1585
[3] Crystallographic orientation contrast associated with Ga+ ion channeling for Fe and Cu in focused ion beam method, Y. Yahiro, K. Kaneko, T. Fujita, W.-J. Moon and Z. Horita, J. Electron Microscopy (2004) 53 571–576
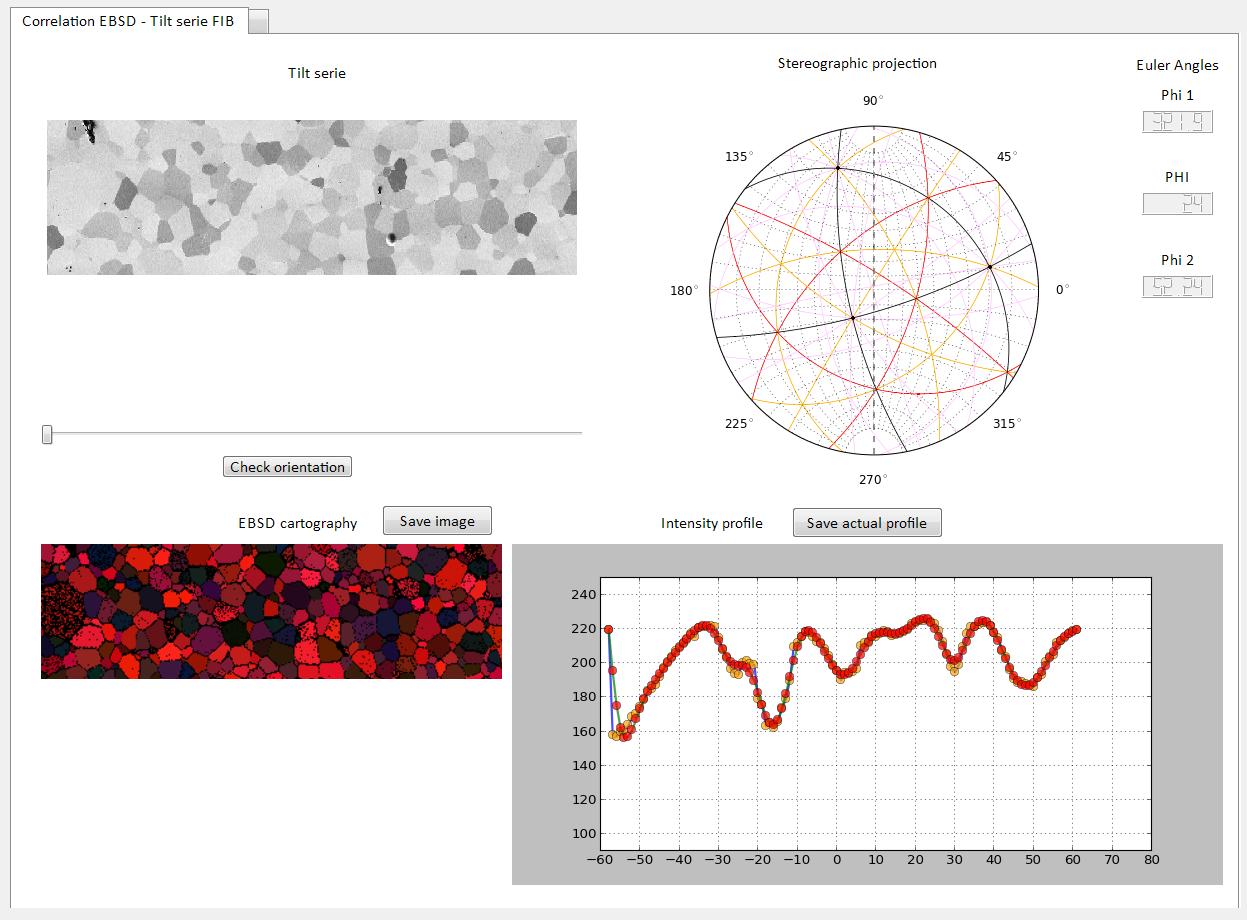
Fig. 1: Snapshot of the software written to extract intensity profiles from a tilt series and Euler angles from an EBSD map acquired on the same area |
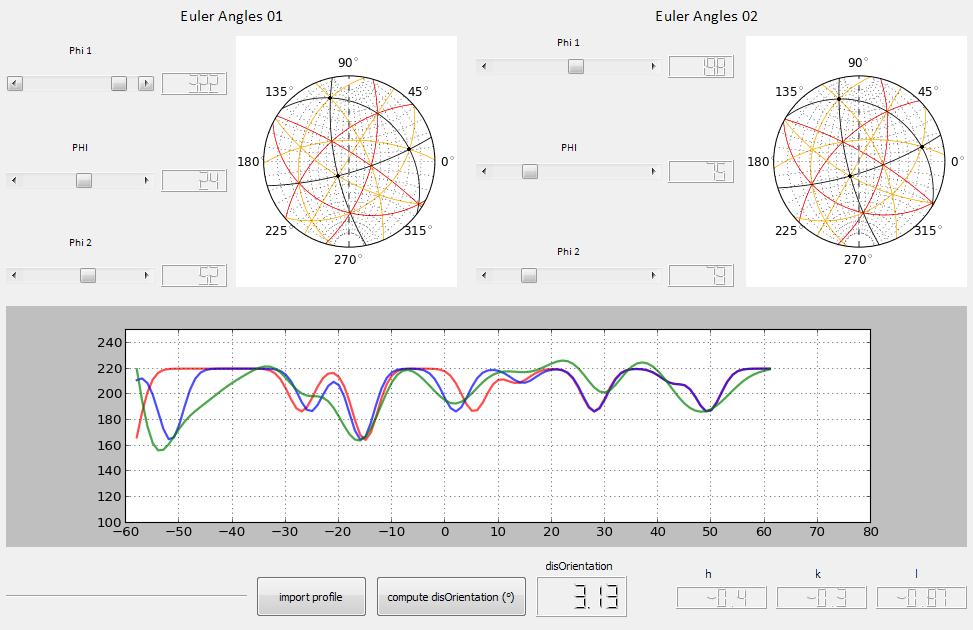
Fig. 2: Snapshot of the software written to compare the experimental profile (green), the semi-empirical profile corresponding to EBSD orientation (red), and the best fit semi-empirical profile found in our database (blue). In this case, the disorientation between the EBSD orientation and the ‘best fit’ orientation is around 3°only |