IT-11-P-2437 Reconstruction of the projected crystal potential using HRTEM – prospects for materials science investigations
Potential reconstruction is the logical continuation of wave function reconstruction [1–3] in high-resolution electron microscopy. It aims at eliminating the problems in the structural interpretation of reconstructed wave functions, chiefly imposed by the effects of dynamical electron diffraction. These effects cause a non-linear relation of atomic scattering power and modulation of the wave function [4], and the local modulation near atomic columns can be further obscured through delocalisation and asymmetries induced by crystal tilt.
A series of investigations using the channelling model of dynamical electron diffraction [4] and a rapid and stable potential reconstruction algorithm revealed that the projected crystal potential can be determined for thick objects [5]. Object thickness, residual defocus aberration of the wave function, and phenomenological absorption, parameters often unknown in experiment, can be fitted self-consistently together with the projected potential [6], as well as crystal tilt [7].
In a materials science investigation of a thin Ba0.5Sr0.5Co0.8Fe0.2O3 (BSCF) crystal a through-focus series of 20 images was recorded with an aberration-corrected TITAN 80-300 microscope operated at 300 kV. After wave function reconstruction and numerical aberration correction up to the information limit of 0.08 nm (Fig. 1, right) the projected potential (Fig. 2, left) was reconstructed with a best fit of 8.4 nm object thickness, 1.6 nm residual defocus, 7.0 nm–1 crystal tilt, and a small residual of S = 4.5%. The potential map is free from non-linear contrast modulation, and the effects of tilt are strongly reduced. Column-by-column measurement of the potential maxima at the oxygen sites reveals through a histogram single oxygen atom precision of 2.6 volt per atom (Fig. 2, right). The three maxima of the distribution indicate a high concentration of oxygen vacancies.
[1] H Lichte, Ultramicroscopy 20 (1986), p. 293.
[2] W Coene et al, Phys. Rev. Lett. 69 (1992), p. 3743.
[3] A Thust et al, Ultramicroscopy 64 (1996), p. 211.
[4] K Kambe, G Lehmpfuhl and F Fujimoto, Z. Naturforsch. A29 (1974), p. 1034.
[5] M Lentzen and K Urban, Acta Cryst. A56 (2000), p. 235.
[6] M Lentzen, Ultramicroscopy 110 (2010), p. 517.
[7] M Lentzen, Proceedings MC2011 Kiel (2011), IM2 P133.
JB gratefully acknowledges funding from the German Federal Ministry of Economics and Technology within the COORETEC initiative.
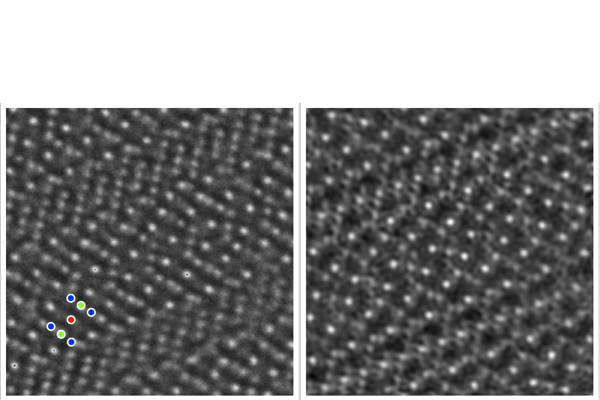
Fig. 1: (left) High-resolution image of BSCF at bright-atom pass-band conditions, red: Ba/Sr, green: Co/Fe, blue: O. (right) Phase of reconstructed exit wave function of BSCF. Frames are 3.4 nm × 3.4 nm. |
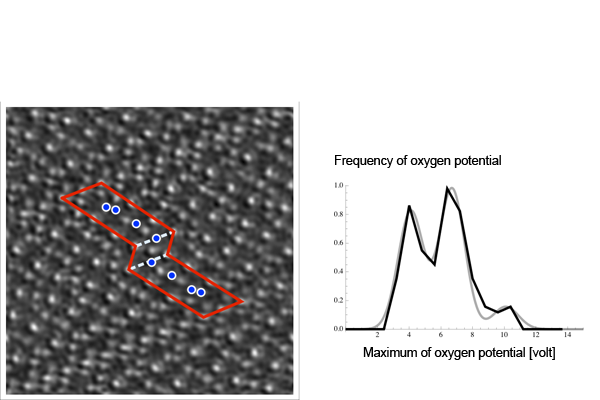
Fig. 2: (left) Reconstructed projected potential of BSCF, frame 3.4 nm by 3.4 nm, red: projected unit cell, blue: oxygen columns used for histogram analysis, dashed: Σ3 twin boundaries. (right) black: frequency of oxygen potential maxima versus maximum of oxygen potential (volt), grey: fit of the distribution with three gaussians. |