IT-6-P-2380 Controlled environment specimen transfer for investigation of catalysts by ETEM
In situ studies of functional materials are of utmost importance in order to give fundamental insight into the state of the material under working conditions. Compromises on specimen geometry, gas pressure, gas composition etc. are often necessary, thus introducing material and pressure gaps. Environmental TEM (ETEM) has rather strict limitations concerning specimen geometry and gas path length [1]. Our efforts focus on establishing specimen transfer under controlled environment conditions (in situ transfer) between complementary in situ characterization techniques including ETEM to bridge the pressure, temperature and materials gaps. This work presents the use of a dedicated TEM specimen holder, capable of sealing and heating during specimen transfer between an in situ X-ray diffraction spectrometer (XRD) and an ETEM. The XRD illustrated in Fig. 1 is well-suited for long term in situ experiments, while continuously measuring the state of the specimen using XRD and the catalytic activity by mass spectrometry. In situ transfer of the sample to the ETEM allows intermittent study of the catalyst in a reactive environment at atomic resolution.
A methanol catalyst Cu/ZnO/Al2O3-catalyst [2] has been studied during catalyst formation and during methanol synthesis to validate the TEM holder made to realize in situ transfer. The specimen was divided into two fractions and loaded in a reactor chamber (RC) of the XRD and in the TEM specimen holder, respectively. The latter was inserted in the TEM specimen holder dock (SD), mounted on the reactor chamber exhaust line. Activity and the dynamic behavior of the catalysts during the treatments was measured by mass spectrometry (MS) and XRD, respectively. After treatment the specimen was sealed in the TEM specimen holder and transferred to the ETEM maintaining the gas composition and temperature.
Figure 2 shows XRD patterns of the Cu/ZnO/Al2O3-catalyst during the reduction treatment in the in situ XRD. The oxidic Cu (● ♦) is clearly reduced to metallic Cu (■). Figure 3 shows electron energy-loss spectra (EELS) of the specimen prior to any treatment (solid line) and after reduction in the XRD system and subsequently transfer to the ETEM at reaction conditions. The pronounced features around 931 eV and 951 eV (white-lines), observed prior to reduction (solid line) indicate an oxidic state of the Cu catalyst. The Cu L2,3 ionization edge fingerprints of metallic Cu contains step-like features in the electron energy-loss spectrum as observed in Fig. 3 after reduction (dashed line). This shows that the specimen was reduced in the XRD system and remained reduced during in situ transfer to the ETEM.
[1] T. W. Hansen et al., Mater. Sci. Technol., 26, p1338 (2010)
[2] C. Baltes et al., J. Catal., 258, p334 (2008)
We thank Dr. Irek Sharafutdinov from DTU for preparing the catalyst and we greatly acknowledge The Danish National Research Foundation’s CINF (DNRF54) and The Danish Ministry of Science’s UNIK initiative CASE. The A. P. Møller and Chastine Mc-Kinney Møller foundation is acknowledged for contribution toward the establishment of DTU Cen.
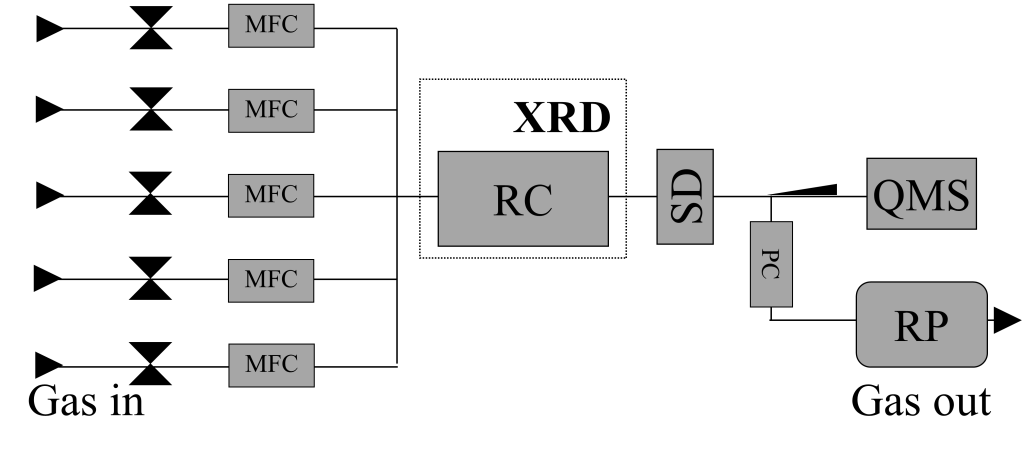
Fig. 1: Schematic diagram of the in situ XRD. RC: Anton Paar reaction cell, SD: specimen holder dock, MFC: mass flow controller, PC: pressure controller, RP: roughing pump, QMS: quadropole mass spectrometer, XRD: x-ray diffractometer. |
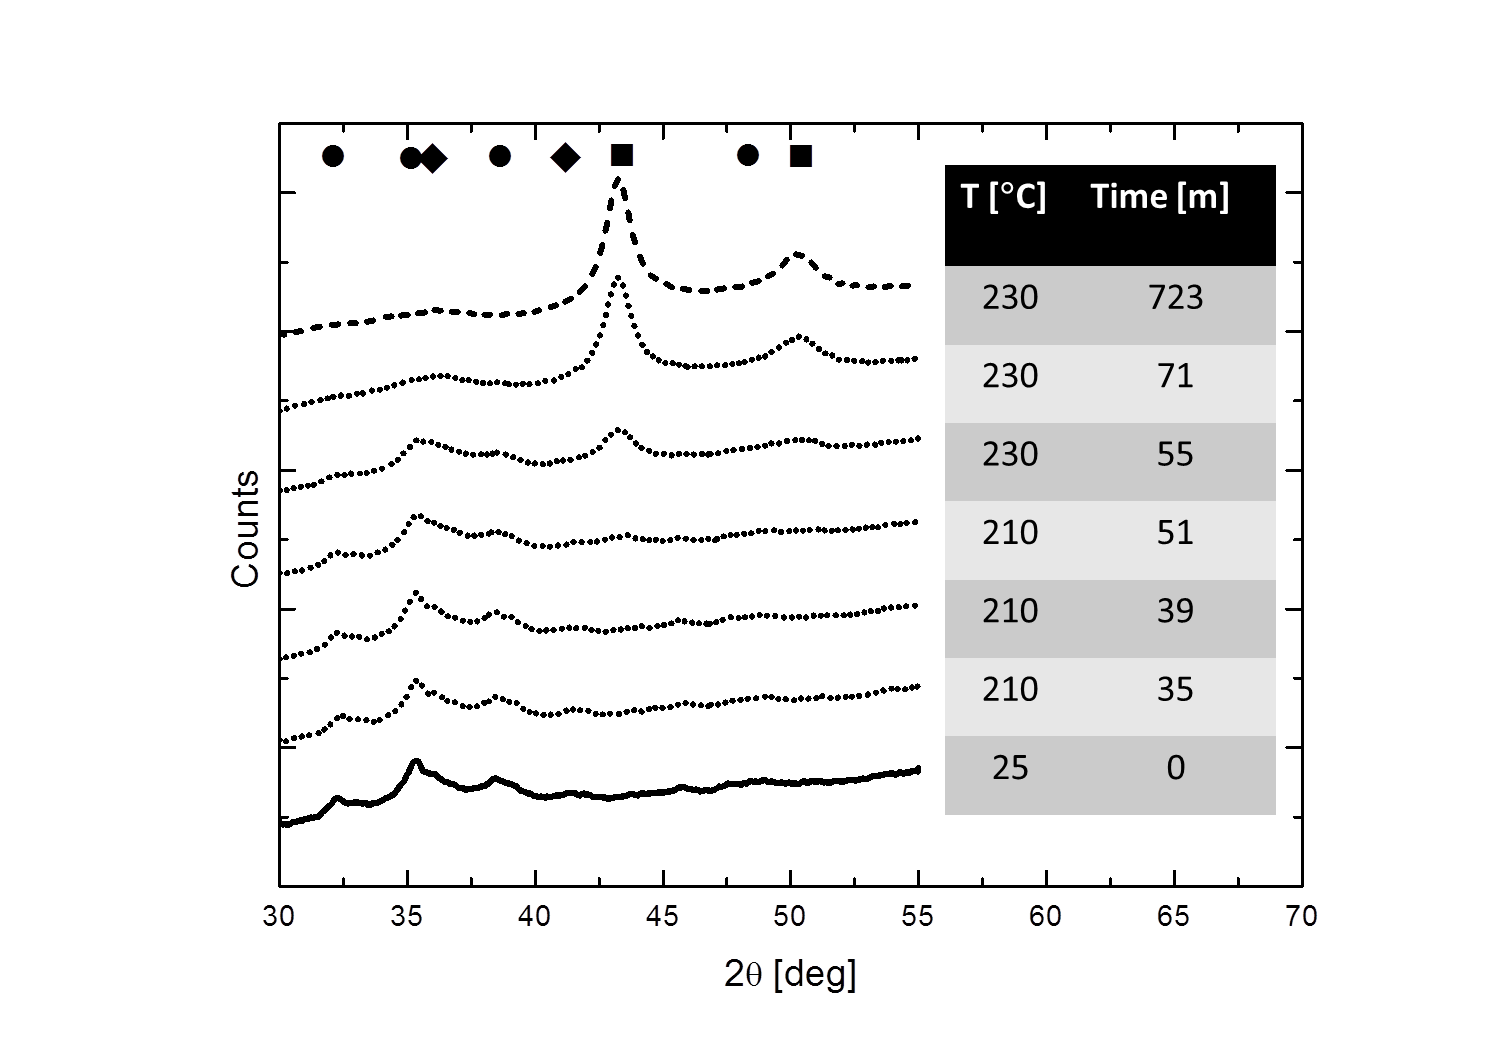
Fig. 2: XRD patterns of the volume Cu/ZnO/Al2O3-catalyst prior to any reduction (solid line), during reduction (dotted lines), and after reduction (dashed line). Theoretical reflections corresponds to metallic Cu ■, CuO ●, and Cu2O ♦. The table shows temperature and time evolution of the obtained patterns. |
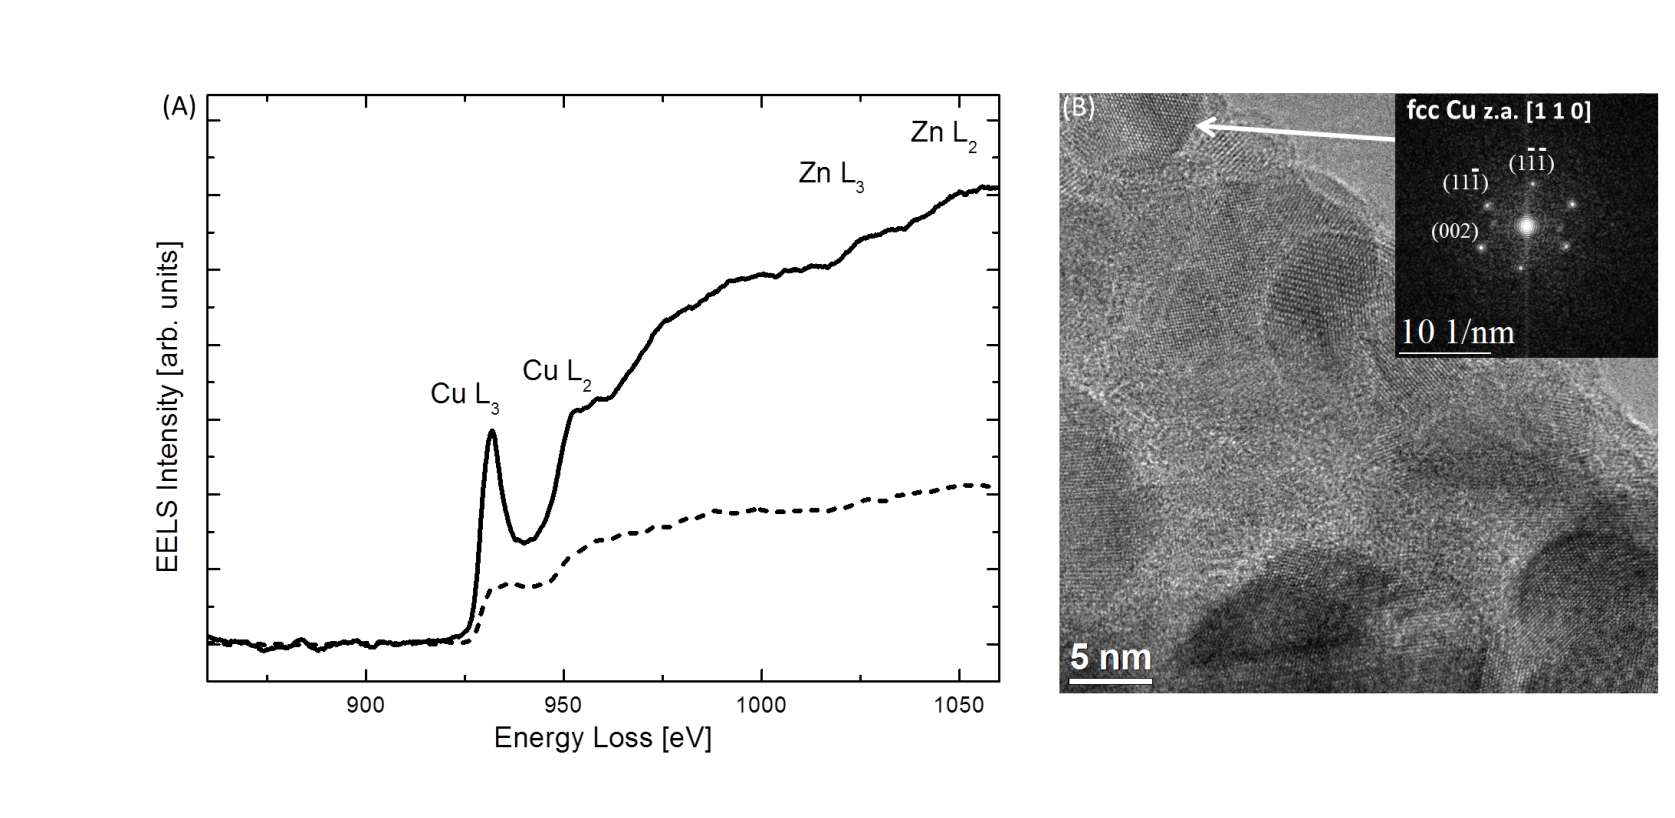
Fig. 3: (A) Electron-energy loss spectra of the Cu/ZnO/Al2O3-catalyst prior to reduction (solid line) and after reduction (dashed line). (B) HRTEM image obtained at RT at 10-4 Pa after in situ transfer. Reduced FFT (insert) of selected particle corresponds to the [110] zone axis of metallic fcc Cu. |
|