IT-11-O-2326 Quantitative comparison of experimental and calculated image waves at atomic resolution
Nowadays, the image wave function within the transmission electron microscope can be experimentally obtained by off-axis electron holography with high quality. This becomes possible by recent progresses made in instrumentation as-well-as in the reconstruction of holograms [1].
By matching experimentally obtained wave functions with specialized empirical models, several structural information, like atomic column positions, can be obtained with high precision, e.g. [2]. Instead of using such empirical models, we report here on quantitative comparisons of the full reconstructed wave function with the full image wave functions as calculated by the Bloch-wave method and the normally applied formulation of wave propagation by the objective lens. The matching between experiment and simulation was done by least-square fitting, i.e. using the complex ℓ2-norm pixelwise.
As experimental (nuisance) parameters the origin of the lattice, the absolute amplitude, the global phase as well as a linear phase change over the field of view were optimized. Beside the global phase, these parameters should, in principle, already be experimentally determined by empty holograms that were taken as reference. However, a linear phase change easily happens due to slight charging of the specimen. Furthermore, the global amplitude might change due to drifts of the illumination.
Optimized specimen parameters are thickness (including a linear change of thickness over the field of view), specimen tilt, and strain (linear change of column distance over the field of view). Considered imaging parameters were focal spread, two-fold astigmatism, axial coma, and defocus as-well-as a linear change of defocus over the field of view (corresponding to an inclined exit surface of the specimen).
Fig. 1 shows an experimentally obtained wave function from a GaAs-wedge recorded in [110] zone axis and the corresponding matched calculation. The left hand sides of Fig. 1 shows the comparison with aberrations applied to calculations. The right hand side shows the same comparison with the experimental wave function corrected by these aberrations, which exhibits the familiar dumbbell contrasts of GaAs. Furthermore, we report on the properties of the minimum and investigate the variances and correlations of the parameters (Fig. 2 and 3), which manifest in the shape of the minimum, and investigate specimen regions of different thickness.
[1] Niermann & Lehmann, Micron (2014), DOI: 10.1016/j.micron.2014.01.008
[2] S. Bals et al., PRL 96 (2006) 096101
Support by the DFG within SFB787 is kindly acknowledged.
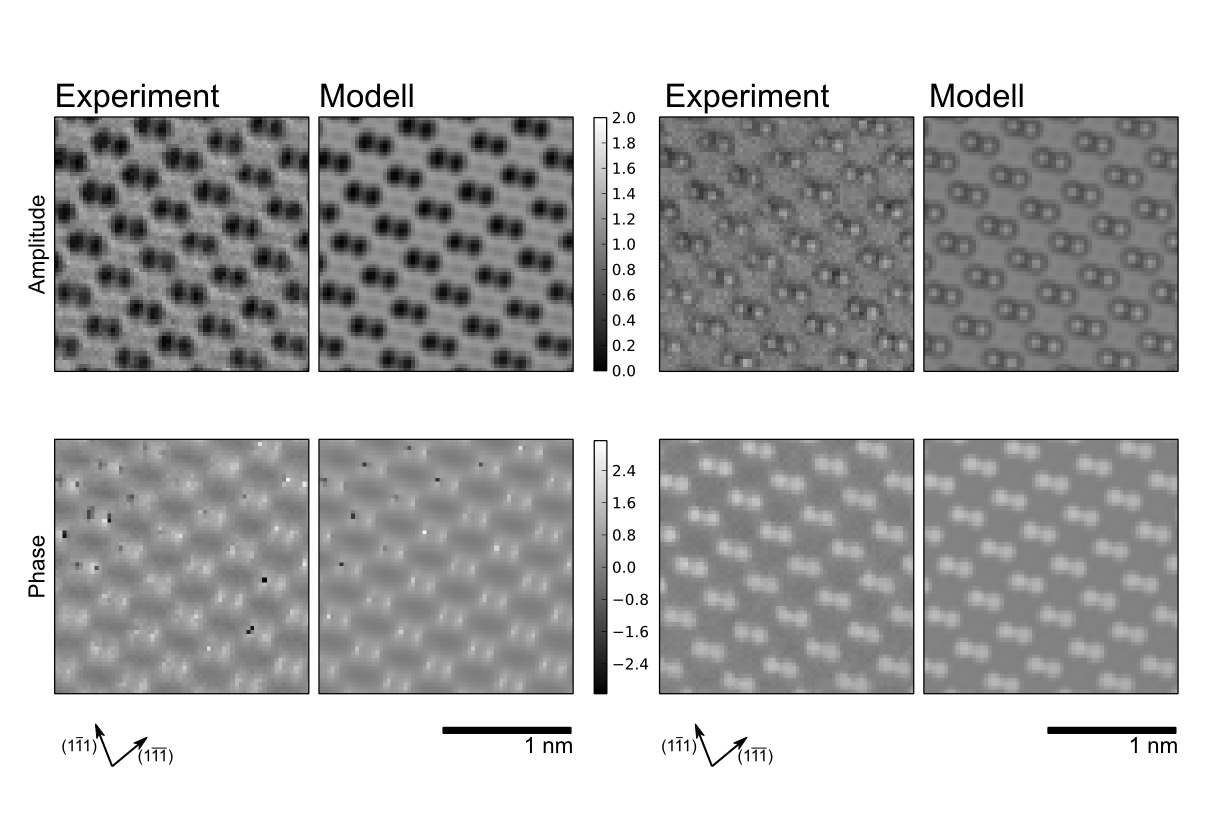
Fig. 1: Comparison between experimental wave function and calculation. The upper and lower rows shows the wave functions in amplitude and phase, respectively. In the left four panels, the residual lens aberrations are applied on the model, in the four panels on the right hand side, the experimental wave is corrected for the lens aberrations. |
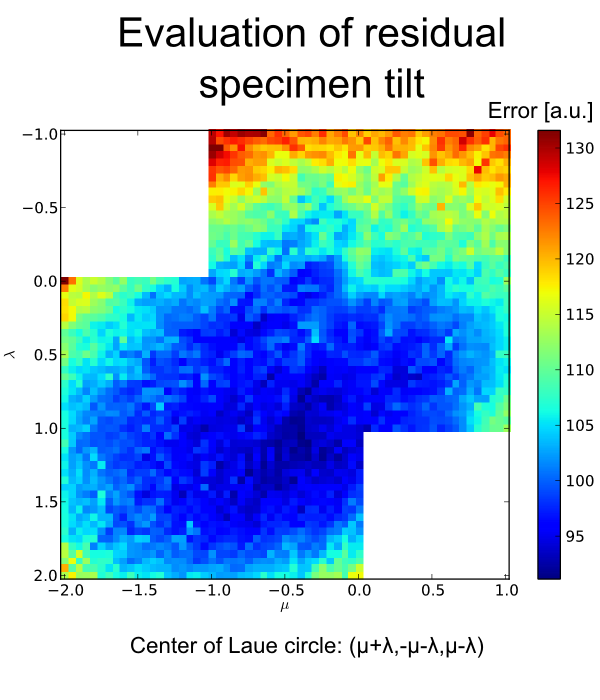
Fig. 2: Evaluation of mismatch in dependence of specimen tilt. The tilt is expressed by the coordinates of the center of the Laue circle, zone axis is [110]. The orientation of the reciprocal space is indicated in Fig. 1. The minimum is close to (0.5,-0.5,1.5). (Here only a constant thickness/defocus over the field was assumed). |
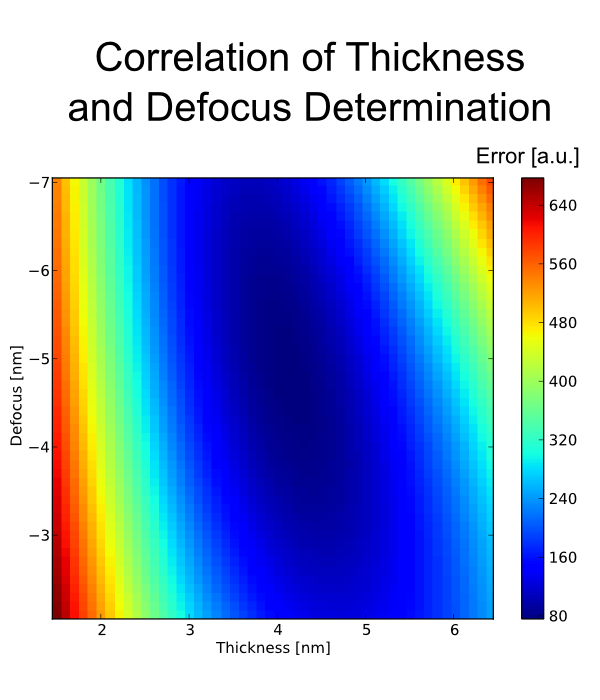
Fig. 3: The shape of the minimum of error function in dependence of defocus and thickness shows the slight correlation between both parameters. The fit is more sensitive to thickness than defocus, since the minimum is more steeper in the former case. (Here only a constant thickness/defocus over the field were assumed). |
|