IT-2-O-2283 Measuring surface atom structures in Pt and Au nanocatalysts with high precision STEM imaging
TEM and STEM aberration correctors make sub-Ang resolution imaging routine. Once atoms are resolved, the question is how precisely can their positions be measured? TEM and STEM regularly achieve precision smaller than the resolution, but STEM encounters practical limits, such as image distortions from instabilities, before reaching the signal to noise ratio (SNR) fundamental precision limit. Combining multiple frames improves SNR and precision. Rigid registration is a common approach, but it does not correct for all types of instabilities. We have developed a non-rigid (NR) registration scheme for STEM images that accounts for all types of image distortions caused by instabilities during acquisition[1, 2].
Fig. 1 shows the results of the NR registration and averaging of a series of 512 HAADF STEM images of GaN. We show that sub-pm precision is achieved by fitting each Ga column to a 2D Gaussian, calculating the interatomic separations as shown in the histograms in Fig. 1(c) and (d), and using the standard deviation as the precision. The sub-pm precision in the x and y directions (0.74 and 0.85 pm) is reproducible and is 5-7 better than rigid registration.
A multislice simulated HAADF STEM image of a Si [110] dislocation core, shown in Fig. 2(a) was used to create an image series that includes distortions representative of real experiments, including thermal drift, floor vibrations, acoustic noise, electromagnetic fields, and electronic instabilities. Fig. 2(b) shows the NR registered and averaged image of the distorted series, demonstrating that inhomogeneous strain is preserved by NR registration.
NR registering and averaging STEM images allows for pm-scale measurements of surface atom bond length variation in Pt nanoparticles, which are prototypical noble metal catalysts. NP’s surface structure is crucial to their chemical activity but measuring it is extremely challenging. Fig. 3(a) shows that a Pt nanocatalyst exhibits pm-scale contraction of atoms at a (1-11)/(-1-11) corner and expansion of a (1-11) facet, with very little lateral displacement. Standardless atom counting on the same NR registered STEM image shows that the Pt NP is between 1 and 8 atoms thick with <1 atom uncertainty, as shown in Fig. 3(b). High precision in both positions and thickness are enabled by the extremely high SNR after NR registration. In general, STEM imaging with pm-precision will aid in understanding atomic displacement fields important in catalysis, defects, interfaces, and ferroic materials.
[1] Berkels et al, Ultramic. 138, 46 (2014).
[2] Yankovich et al, “Picometer-Precision Analysis of STEM Images of Pt Nanocatalysts” under review (2014).
We acknowledge funding from the Department of Energy, Basic Energy Sciences (DE-FG02-08ER46547), NSF (DMS 1222390), USC’s Special Priority Program SPP 1324, and the Excellence Initiative of the German federal and state governments, and the UW Materials Research Science and Engineering Center (DMR-1121288).
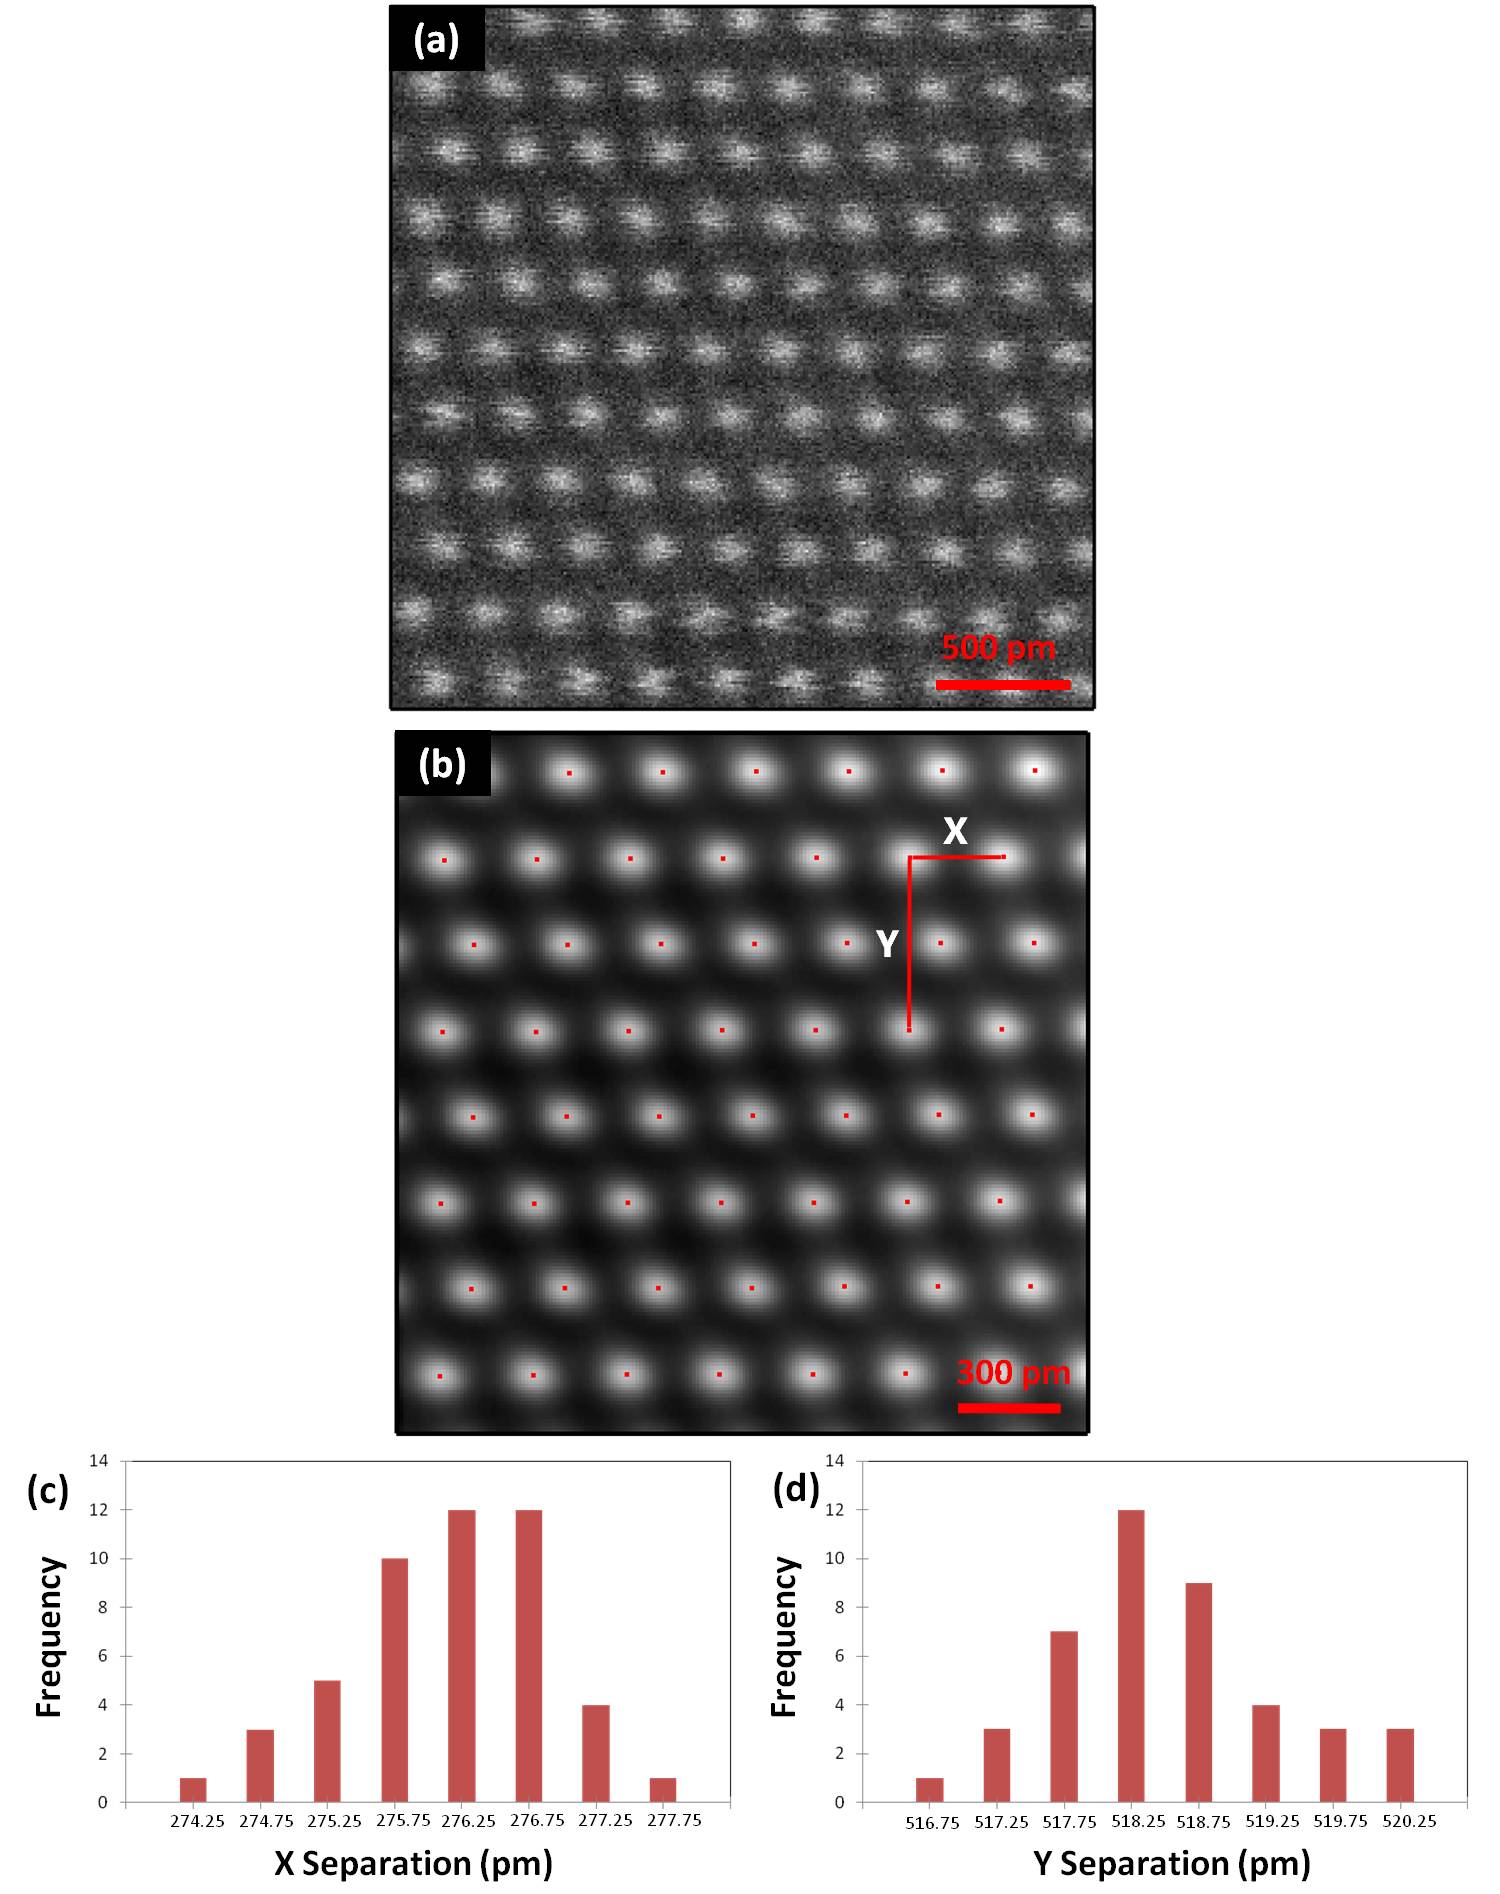
Fig. 1: (a) The first of 512 HAADF STEM images of GaN [11-20]. (b) Average of 512 frames after NR registration. The red dots are the positions of the columns identified by fitting. (c) and (d) Histograms of the X and Y separation measurements from (b). |
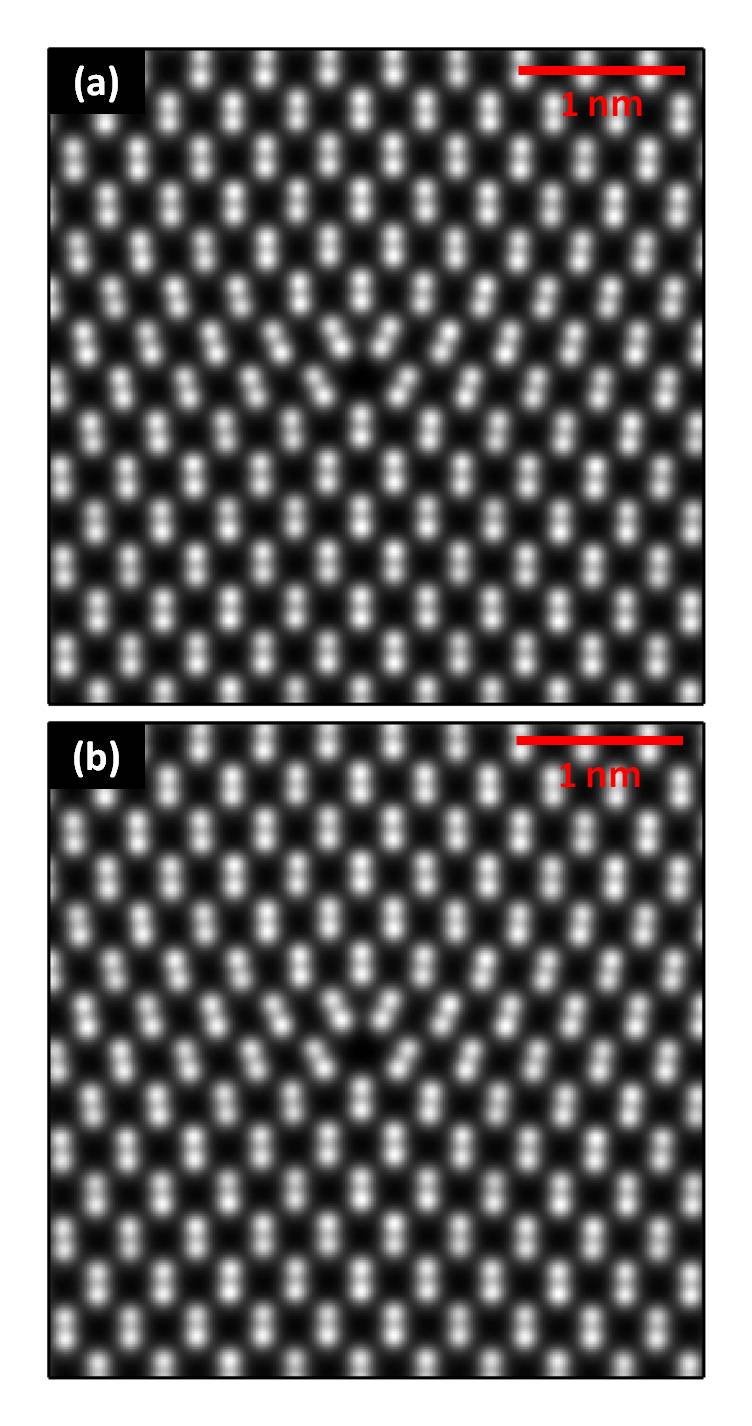
Fig. 2: (a) Simulated HAADF STEM image of a Si [110] dislocation core model displaying an inhomogeneous strain field. (b) NR registered and averaged HAADF STEM image after the simulated image in (a) was made into an image series with typical distortions representative of experimental series. |
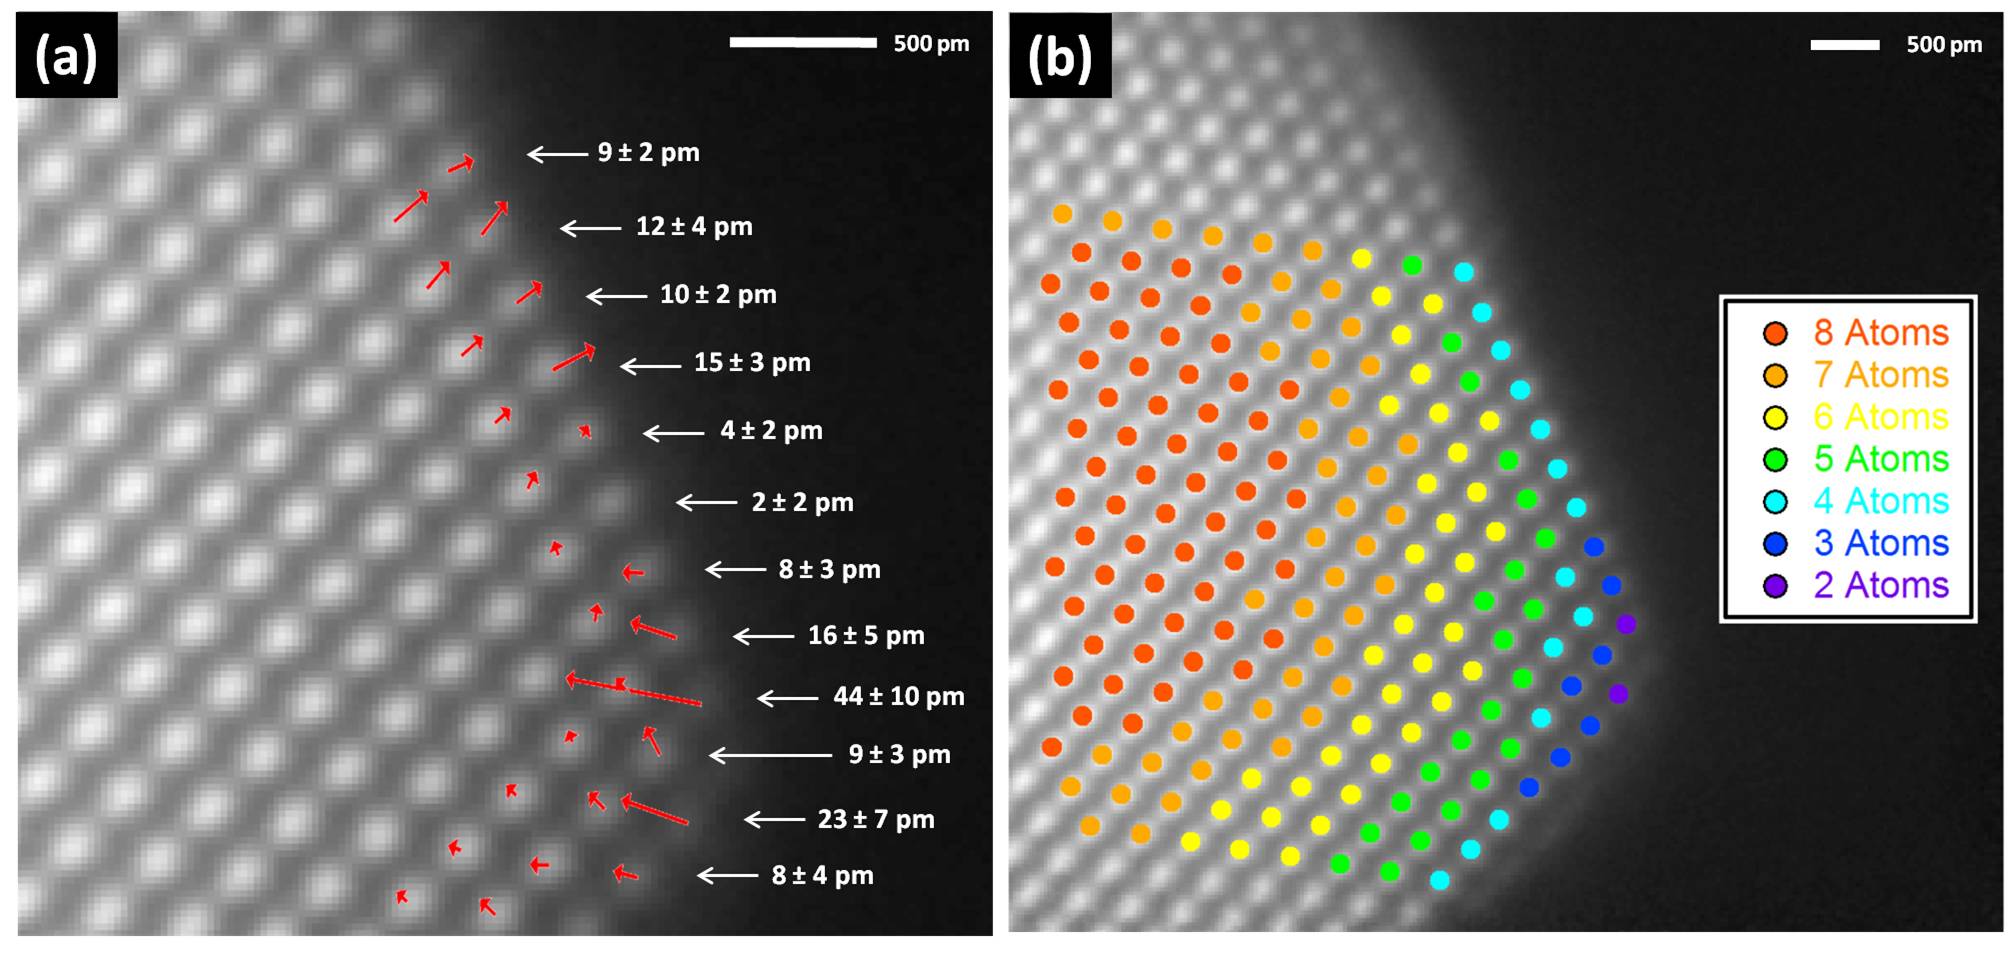
Fig. 3: (a) Average of 56 HAADF STEM images of a Pt [011] nanoparticle after NR registration. The red arrows show magnified displacement vectors of the surface atoms and the displacement magnitudes are labeled in white. (b) The number of atoms in each column determined by comparing the experimental absolute intensities to simulations. |
|