IT-14-P-2144 Imaging nanostructures of nitrogen/oxygen molecules at HOPG-water interfaces with different atomic force microscopy modes
Nanobubbles, cap-shaped soft nanostructures, and micropancakes, quasi-2D layered structures, have been reported at the interfaces between hydrophobic solid surfaces and water based on atomic force microscopy (AFM) studies [1]. Previous studies have indicated that these interfacial structures contain gases because they are formed under water saturated or supersaturated with gases. They were considered as novel gaseous states by many researchers. However, there are several puzzles about them, such as the high stability, the nature, the rather flat morphology, etc.
We have investigated these interfacial structures on highly ordered pyrolytic graphite (HOPG) surfaces in pure water with different atomic force microscopy (AFM) modes, including the frequency-modulation (FM), the tapping, and PeakForce techniques. The FM mode provides more accurate measurement of the surface profiles of nanobubbles than the other two imaging modes (Fig.1). The height obtained with PeakForce mode is smaller than the true height of nanobubbles due to a snap-in when the tip touches a nanobubble, as shown in the force vs the tip-sample separation curve (Fig. 2a). This is because a positive peak force is required to achieve stable imaging. The resonance frequency shift vs the tip-sample separation curve (Fig. 2b) shows a sharp increase in the resonance frequency when the tip touches a nanobubble, thus the snap-in has little effect on the height measurement in the FM mode. Similar force curves are seen on micropancakes. Combining AFM images obtained with these modes, models for nanobubbles and micropancakes are proposed, which can provide a better explanation for the high stability of these interfacial structures.
[1] Seddon J. R. T. and Lohse D.; J. Phys: Condens. Matter 2011, 23, 133001.
This research is supported by the National Science Council of ROC (NSC96-2628-M-001-010-MY3 and NSC99-2112-M-001-029-MY3) and Academia Sinica.
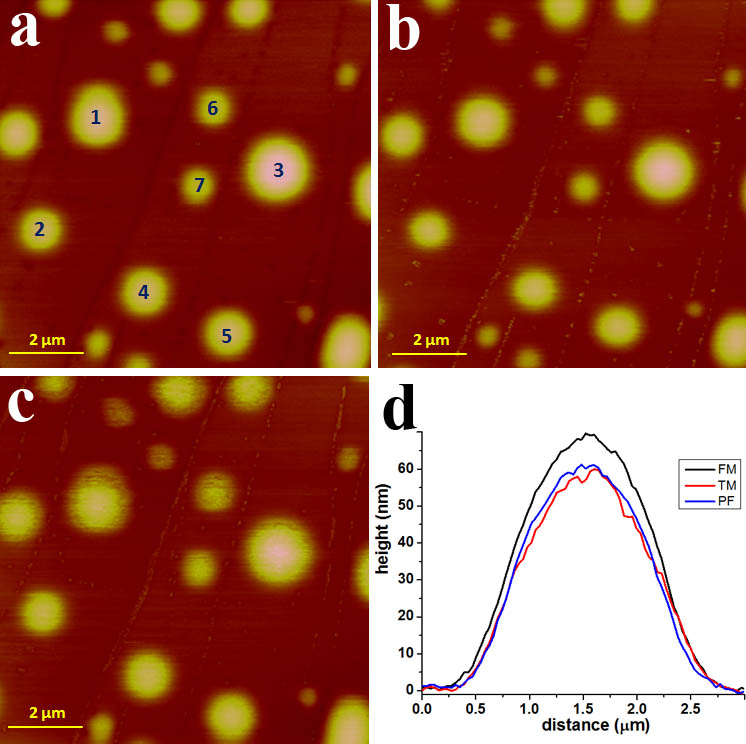
Fig. 1: Topographic imaging of nanobubbles on HOPG in DI water taken with (a) the FM mode, (b) PeakForce mode, (c) the tapping mode (TM). (d) Horizontal height profiles across the center of nanobubble 3 taken with the FM PF, and TM modes. |
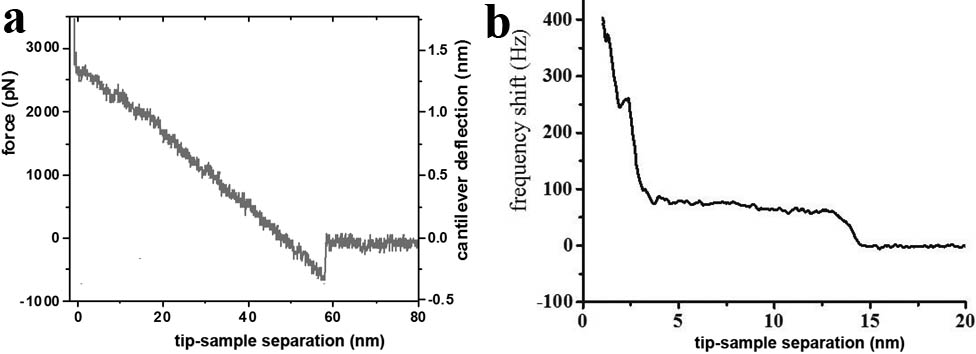
Fig. 2: Approaching force curve measured on nanobubbles at HOPG-water interfaces. (a) Force vs the tip-sample separation curve. (b) Resonance frequency shift vs the tip-sample separation curve. |