IT-10-O-2126 Four-dimensional simultaneous EELS & EDX tomography of an Al-Si based alloy
Electron tomography is a powerful technique for 3D characterization at the nanoscale. Recent developments in electron tomography include the use of TEM imaging techniques based on inelastic scattering, such as EFTEM, EELS and EDX [1,2] as well as reconstruction algorithms, including prior information in the reconstruction process, such as total-variation (TV) minimization [3].
Modification of eutectic Si in Al-Si alloys by modifying elements such as Sr, Na or Yb is a frequently used method to improve mechanical properties of alloys [4]. Nevertheless the modification mechanisms are still a matter of debate and require understanding the elemental distribution down to the atomic level.
In this work we investigate an Al-5 wt.% Si alloy with 15 ppm Na and 6500 ppm Yb. On this alloy we demonstrate simultaneous EELS and EDX tomography. We apply a TV minimization reconstruction algorithm to elemental maps extracted from analytical TEM data and we reconstruct spectral EELS and EDX data, to get local spectra in three dimensions.
Tomography experiments were performed on a probe-corrected FEI Titan3 microscope operated at 300 kV, equipped with a Gatan GIF Quantum energy filter and a Bruker Super-X detector. Low-loss (-80 to 920 eV), core-loss EELS (1120 to 2120 eV) and EDX spectrum images of a FIB-prepared needle-shaped sample were acquired every 5° over a range of +/-75°. All analytical tomography data was aligned based on HAADF STEM images, acquired at the same time as the spectrum images. 2D elemental maps were extracted for each tilt angle from both EDX and EELS spectrum image data sets.
Reconstruction of the elemental maps was done with the simultaneous iterative reconstruction technique (SIRT) as well as using TV minimization. TV minimization is an efficient method for reconstruction from few and noisy projections, as is the case for elemental maps. It assumes locally constant regions in the reconstruction, a valid assumption as we expect sharp interfaces between Yb-rich precipitates, Si-particles and the Al-rich matrix. Fig. 1 shows reconstructions of elemental maps extracted from EDX data and Fig. 2 shows the same reconstructions of elemental maps for EELS core-loss data.
Additionally we reconstructed spectral EDX and EELS data. Using SIRT each spectral channel is reconstructed, which provides four-dimensional datasets containing EELS and EDX spectra for each voxel (see Fig. 3).
This work founds a basis for quantitative elemental mapping in three dimensions and can be extended towards 3D chemical fingerprinting or extraction of local electrical and optical properties.
[1] Jarausch et al, Ultramicroscopy 109:326, 2009
[2] Lepinay et al, Micron 47:43, 2013
[3] Leary et al, Ultramicroscopy 131:70, 2013
[4] Li et al, Philos. Mag. 92:3789, 2012
The authors would like to thank Jiehua Li and Peter Schumacher from Chair of Casting Research, University of Leoben for providing the samples, This work has been supported by the FFG OPTIMATSTRUCT project and within the European Union's 7th Framework Programme in the project ESTEEM2.
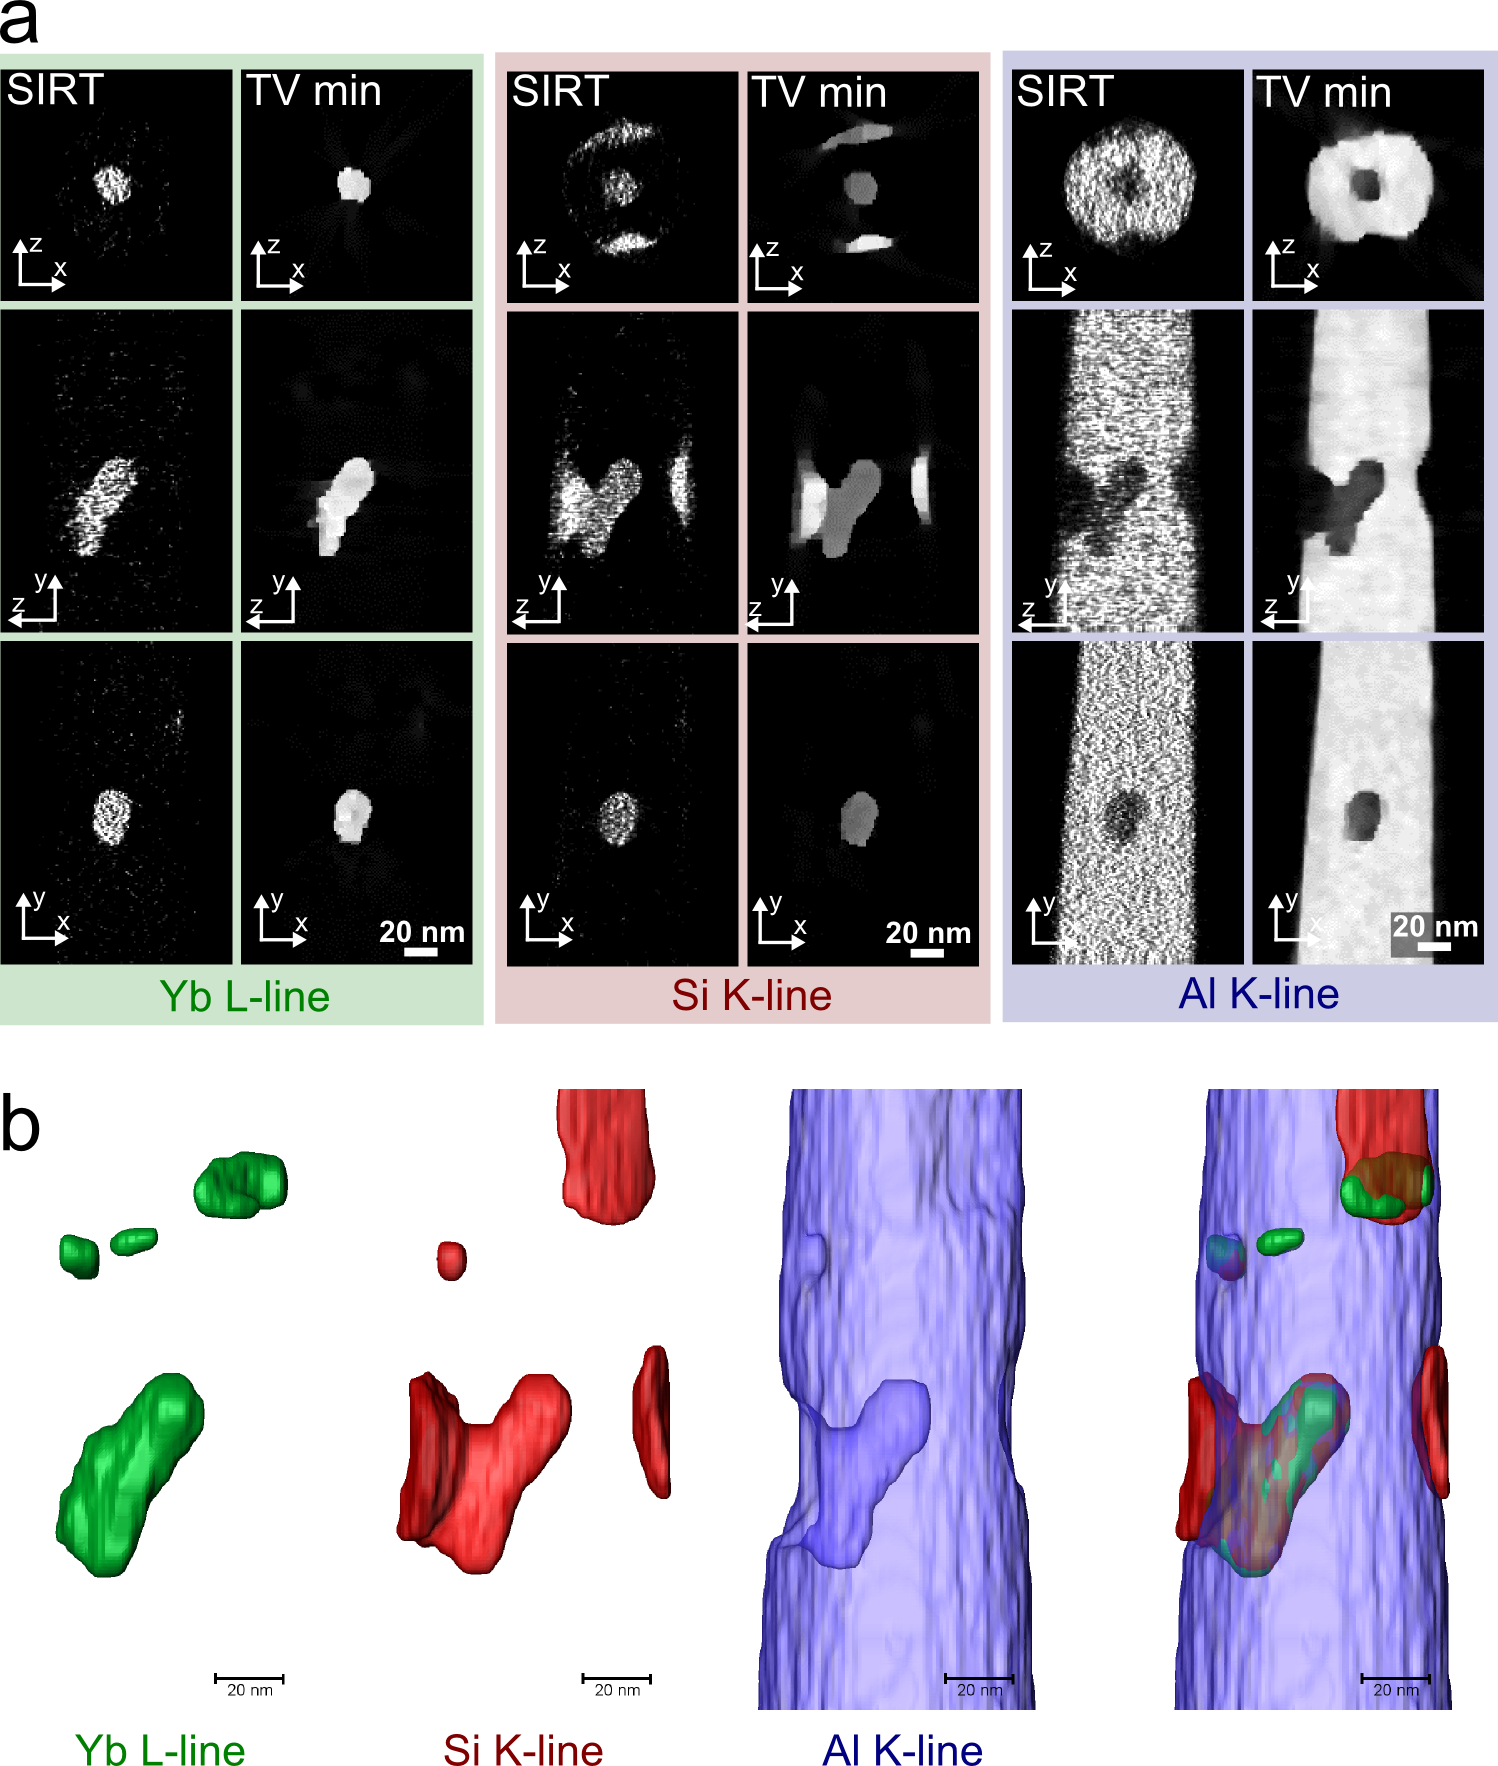
Fig. 1: Reconstructions of elemental maps extracted from EDX data. (a) Orthogonal slices through reconstructions of the Yb L-line, Si K-line and Al K-line using SIRT and TV minimization. (b) 3D surfaces extracted from the TV minimization reconstructions. |
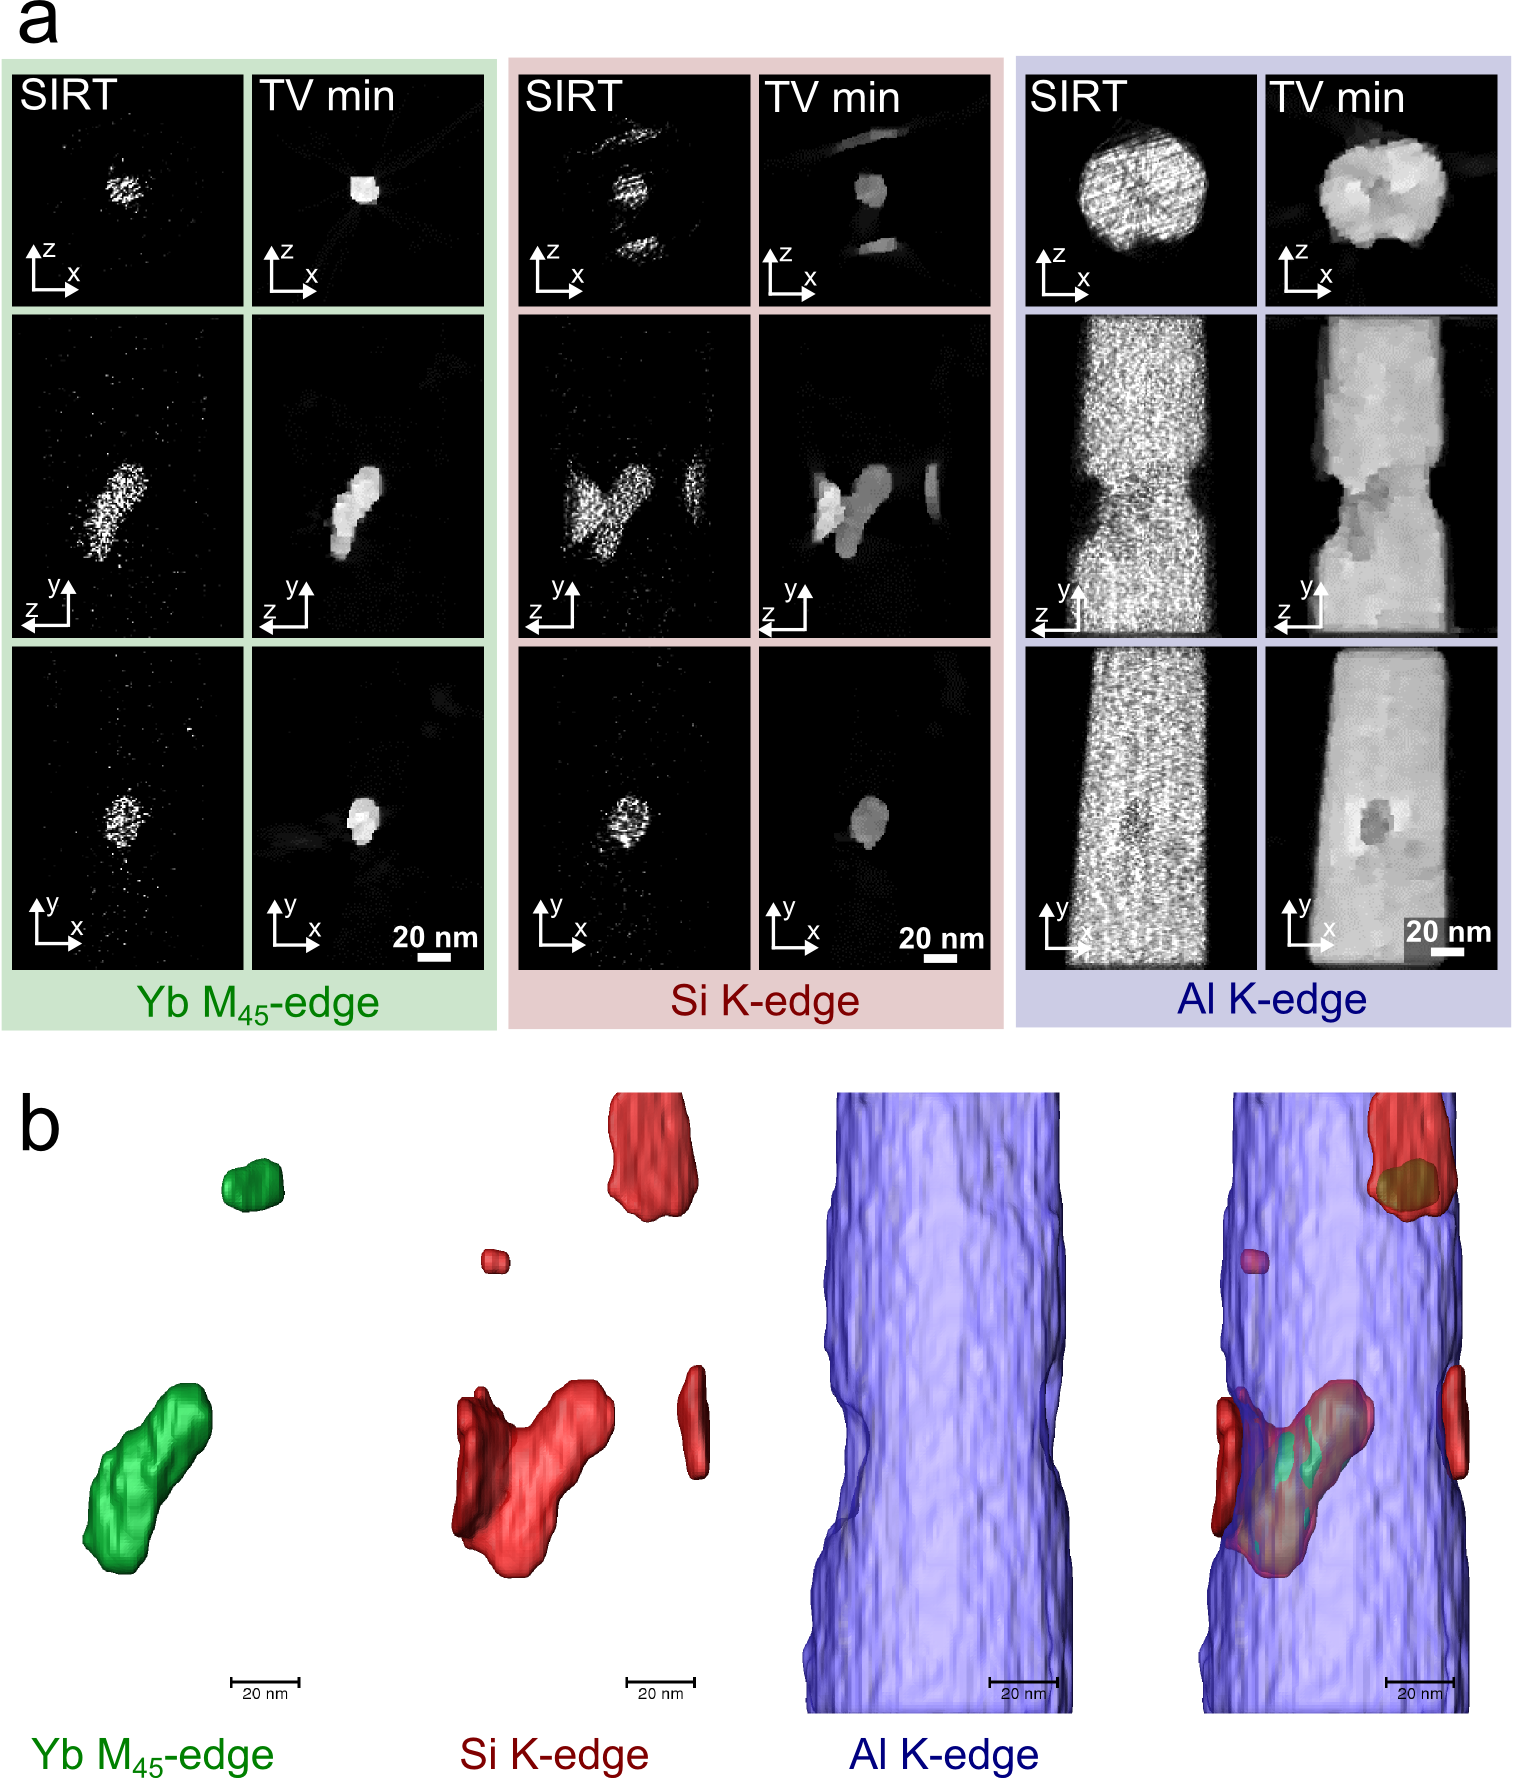
Fig. 2: Reconstructions of elemental maps extracted from EELS core-loss data. (a) Orthogonal slices through reconstructions of the Yb M45-edge, Si K-edge and Al K-edge using SIRT and TV minimization. (b) 3D surfaces extracted from the TV minimization reconstructions. |
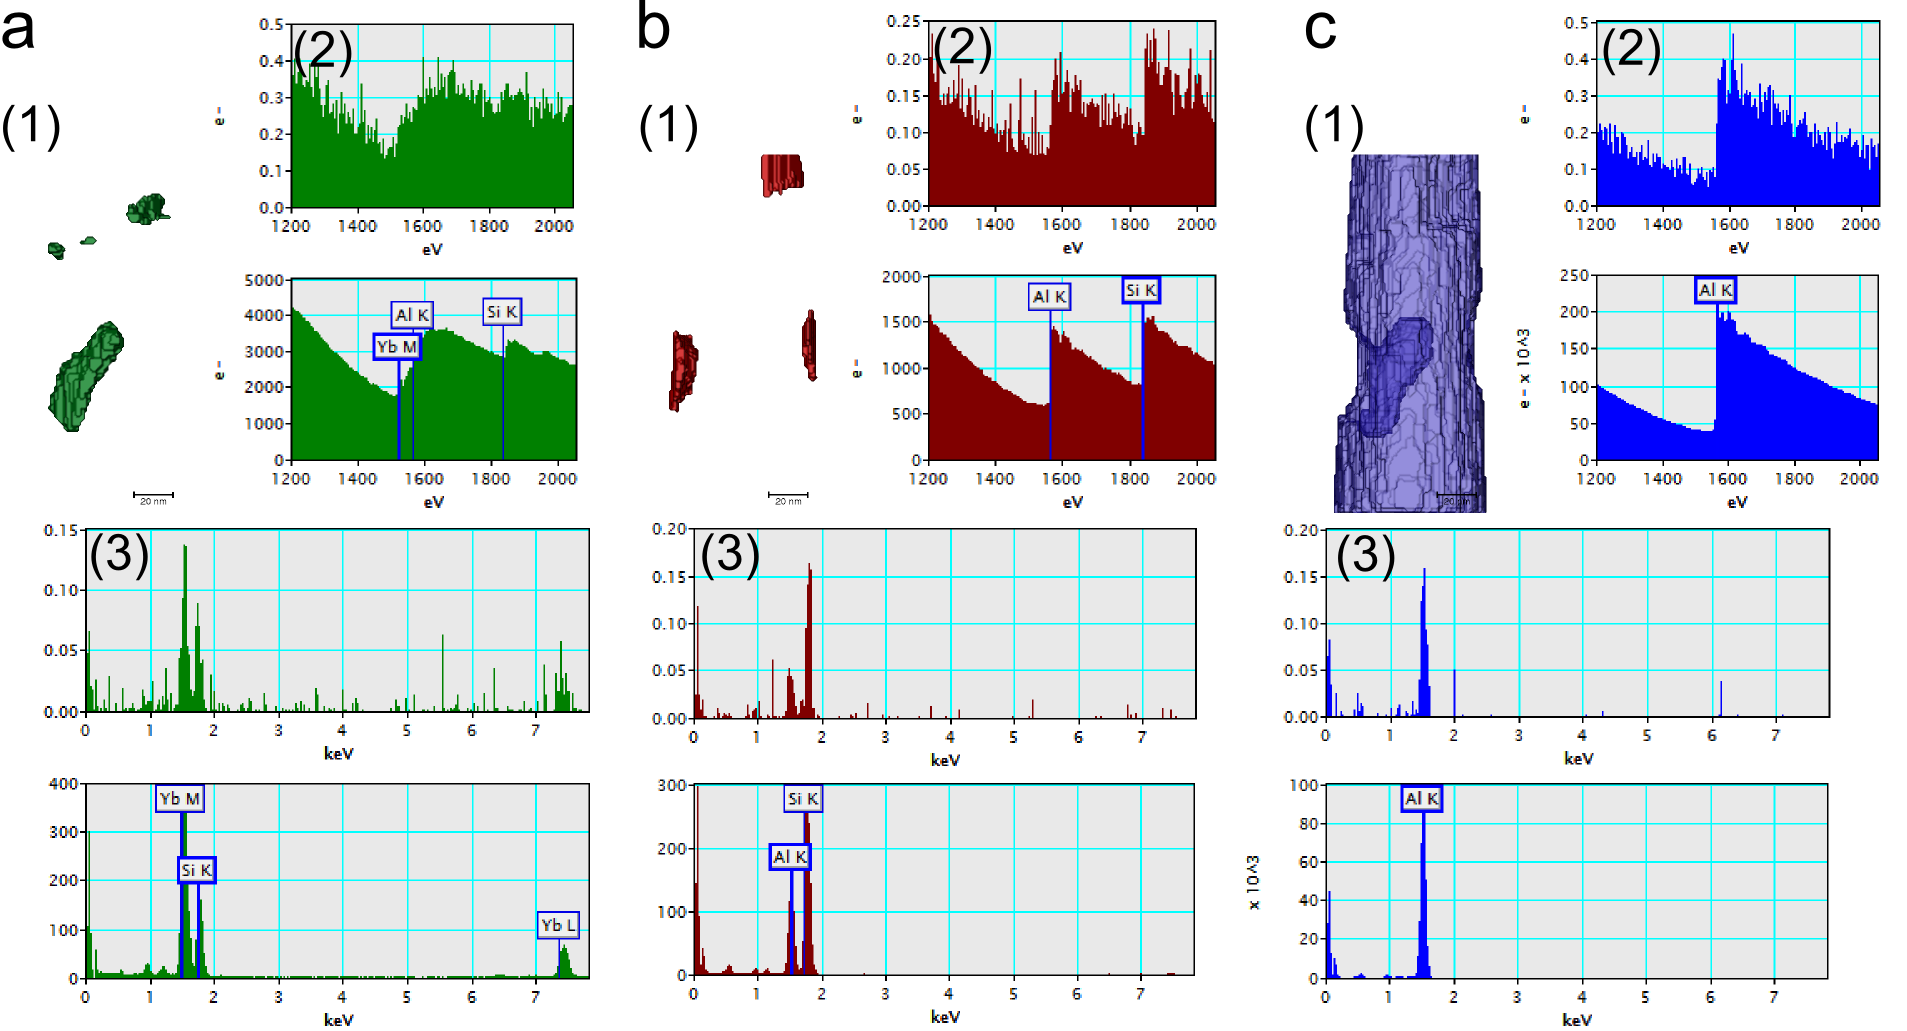
Fig. 3: Local reconstructed spectra from (a) Yb-rich precipitates, (b) Si-rich region, (c) Al-rich matrix. (1) Masks of the investigated regions, (2) core-loss EELS spectra, (3) EDX spectra. (2)-(3) show single voxel spectra (top) and spectra summed over all voxels of the masks shown in (1) (bottom). |
|