IT-6-P-2009 Development and application of environmental high voltage electron microscope
Introduction:
For the practical use of hydrogen storage materials, the improvement of their hydrogen storage properties has been required. In order to improve the properties, we should understand the mechanisms and the dynamics of the materials in nano scale. Recent research indicated that a strain field introduced in the materials affected on the properties [1]. For understanding the dynamics in nano scale not only for improving the hydrogen storage properties, but also for developing other functional materials, in-situ TEM is the best way. In this research, we developed a high pressure gas Environmental cell for High Voltage Electron Microscope (EHVEM) and applied to in-situ High-Resolution (HR) observation with increasing hydrogen gas pressure.
Experimental:
The sample was a Pd thin film (~10nm-thick) deposited on a Silicon Nitride (SiN) window film. Firstly, this film was observed in a vacuum condition at room temperature. And then, an in-situ observation was carried out with the hydrogen pressure up to 40 kPa. The microscope used in this study was the EHVEM based on the JEOL ARM-1300 and operated at an acceleration voltage of 1250 kV.
Result and discussion:
The EHVEM allowed an in-situ HR observation in a hydrogen pressure up to 40 kPa. As shown in the Figure.1, however, the lattice fringes of PdH0.6 (200) and (111) grain with a distance of 0.20 nm and 0.23 nm were barely visible at the pressure. This result suggested that there was a significant influence of the gas pressure on the image resolution despite the use of high voltage electron beam.
On the other hand, using the corresponding IFFT (Figure.2) allowed us to recognize some dislocation cores introduced around/in a hydride grain clearly. The result told us that the increase in the number and the distribution change of cores with the pressure.
Reference:
[1] N. Hanada et al. J. Phys. Chem. C 113 (2009) 13450-13455
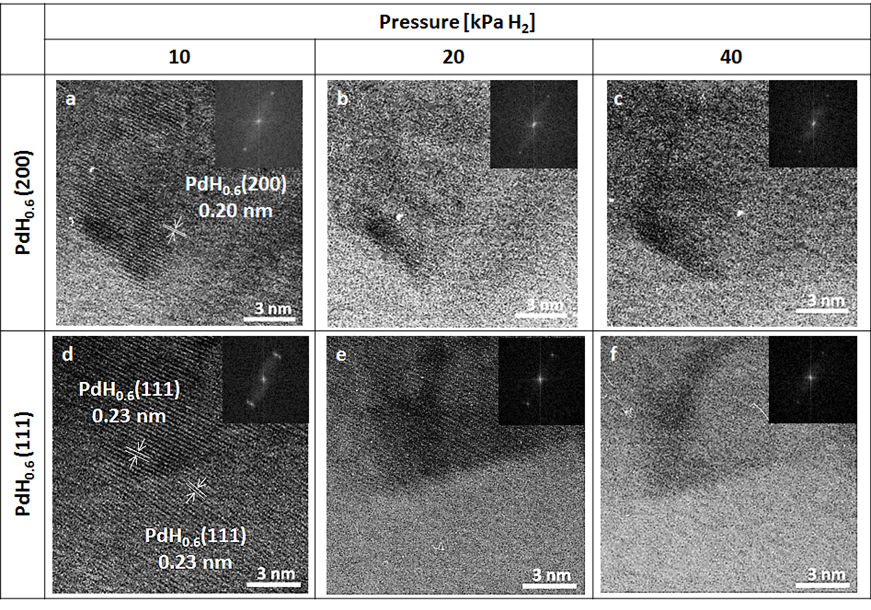
Fig. 1: High resolution images and FFTs (the insets) corresponding to PdH0.6 (200) and (111) in the hydrogen pressure of 10, 20, 40 kPa. |

Fig. 2: High resolution images (the inset) and IFFTs (from white square) corresponding to PdH0.6 (111) in the hydrogen pressure of 10, 20, 40 kPa. |