IT-10-P-1980 Energy dispersive X-ray (EDX) tomography of bimetallic nanoparticles
Electron tomography can be used to provide spectroscopic analysis in three dimensions at nanometer resolution through a variety of imaging techniques. EDX tomography promises accurate simultaneous projections of all elements that fully meet the projection requirement. We present the latest results of three-dimensional elemental analysis using EDX tomography to investigate bimetallic nanoparticles.
The design of the Super-X detector [1] as included on the FEI Titan G2 80-200 has a large solid angle of detection (≈0.8sr) and therefore a count rate high enough to allow EDX tomography of many types of sample. EDX tomography of focused ion beam (FIB) prepared samples is now entirely feasible and results in minimal detector shadowing at any angle [2]. However, FIB prepared rods of free standing nanoparticles are not straightforward to prepare. Dispersing nanoparticles on to a standard TEM grid is a simple preparation method but the grid bars and sample holder shadow the EDX detectors at a range of angles. This prevented acquisition of EDX data at a large range of angles when using traditional single detectors but can be overcome when using the Super-X detector. To combat effects of detector shadowing we have used a simple acquisition-time varying sampling scheme that is guided by prior characterisation of the detector. We acquired EDX spectral images of a single AgAu nanoparticle at a range of tilt angles for a fixed acquisition time. Acquisition time at each tilt angle was then adjusted to provide similar Au counts at each angle (Fig. 1).
We have used our novel acquisition scheme to investigate elemental distributions in bimetallic nanoparticles synthesized via the galvanic replacement reaction, primarily AgAu nanoparticles. The elemental distribution in these nanoparticles is particularly important for their catalytic and optical properties. Two dimensional EDX mapping suggested that the extent of surface segregation in the AgAu nanoparticles varied with composition. Particles with low Au content (below 20 at% Au) appeared to display Au surface segregation and particles with high Au content (above 40 at% Au) displayed Ag surface segregation. However, two dimensional maps cannot categorically reveal surface compositions. For example, it is unclear whether intense lines of Au counts in Fig. 2a are situated on the surface of or within the nanoparticle. For this reason, we performed EDX tomography on nanoparticles that showed, separately, Au and Ag surface segregation (Fig. 2c,d). Through EDX tomography we were able to conclusively show a reversal in surface segregation in AgAu nanoparticles prepared via the galvanic replacement reaction.
References
1 von Harrach, H. S. et al. Microsc. Microanal. 15 (2009), 208-209
2 Lepinay, K. et al. Micron 47 (2013), 43-49
SJH thanks the USA Defense Threat Reduction Agency (grant number HDTRA1-12-1-0013) and Gates Foundation for funding support. PHCC and AM thank FAPESP and CNPq for funding support (grant numbers 2011/06847-0, 2013/19861-6 and 471245/2012-7, respectively).
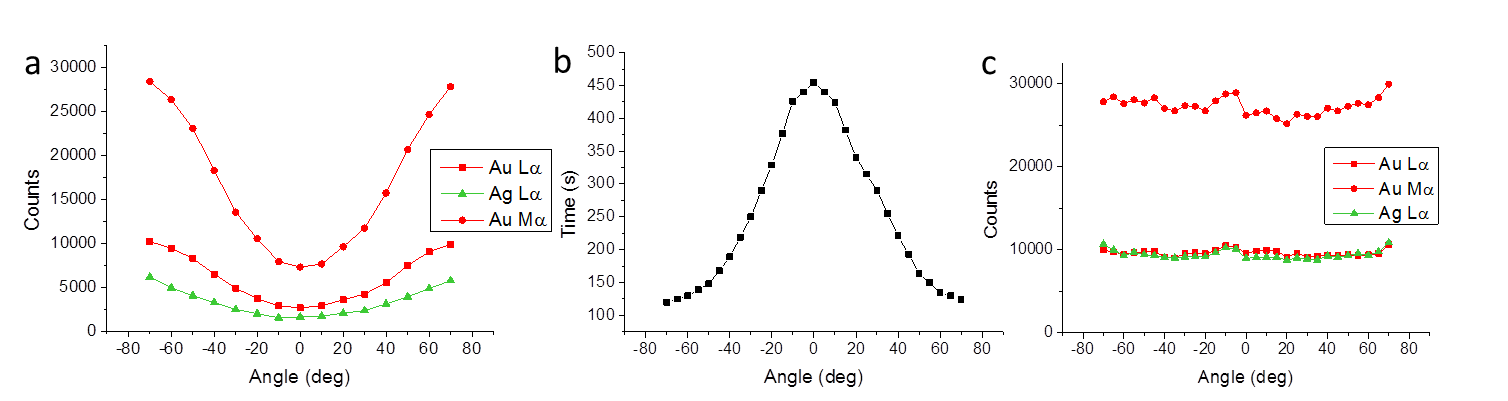
Fig. 1: Figure 1. a) Counts of Au and Ag peaks as a function of tilt angle when using a fixed time acquisition scheme. (b) Varied acquisition-time scheme used in order to correct for detector shadowing by the sample holder. (c) Counts of Au and Ag peaks as a function of tilt angle when the varied acquisition-time scheme is used. |
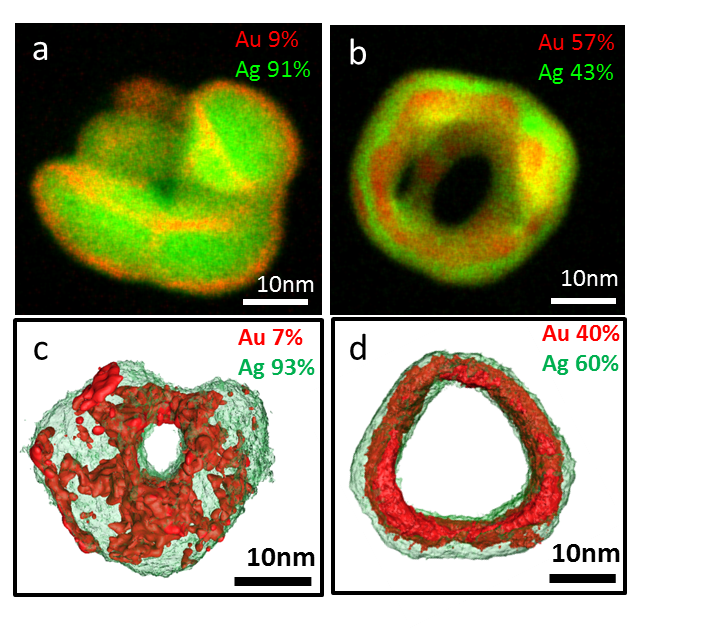
Fig. 2: Figure 2. a,b) Two dimensional EDX spectral images showing Au and Ag distributions within nanoparticles with Au and Ag surface segregation. c,d) Surface visualisations of reconstructed tomograms of Au and Ag in nanoparticles displaying Au and Ag surface segregation. |