IT-5-O-1937 In situ observation of symmetry and bond length induced ELNES changes of the CaCO3 to CaO phase transformation by in-column energy-filtered low-kV TEM
Calcite (CaCO3) is an important system for biomineralization and of enormous importance in the construction industry. When used as material for the construction of buildings, calcite is transformed into CaO by the reaction: CaCO3→CaO+CO2↑ releasing CO2. The same phase transformation of calcite is initiated in the electron microscope. Low dose rates and the low accelerating voltages achievable with the SALVE prototype microscope, enable to monitor right from the start in situ the phase transformation and track the change of chemistry and electronic environment by EELS and ELNES. The coordination of the Ca atom in calcite is close to an octahedral coordination if the ligands were aligned along the x, y and z axis and the octahedron is stretched along the <111> direction. The angles between the Ca-O bonds are 87.25° and 92.75° and the bond length is 2.357 Ǻ in all directions. In cubic CaO the calcium atom is octahedral coordinated with a bond length between Ca and O atoms of 2.407 Ǻ. Induced by the octahedral coordination of calcium in calcite and CaO the degenerated energy levels of the 3d shell split up into t2g and eg energy levels with an energy difference of Δo. Figure 1 presents the ELNES of the Ca L2,3 edge for the 40 kV and 20 kV series. Four peaks can be separated, with two of them correlated to the Ca 2p3/2 →3d (t2g eg) and two of them to the Ca 2p1/2 →3d (t2g eg) transitions. For 40 and 20 kV, we obtained starting peak positions of the Ca-L2,3 edges-characteristic for calcite, indicated by blue dashed lines. The second end peak-position-characteristic for CaO are indicated by red dashed lines. In the mid of the phase transformation a superposition of the starting and end spectra with resolved peak positions is detectable. Solely these two peak positions exist in all spectra. This proved that the change in the peak position cannot be initiated by energy drift of the experimental setup but is caused by the change of the electronic environment of the Ca atom. All peaks shift to lower energies and additionally the energy level splitting Δo increases. During the phase transformation of calcite to CaO, the octahedral coordination of calcium with oxygen as binding partner is preserved, but the distortion is removed and the bond length changes by 5 pm. Calculation of theoretically fitted EELS spectra with the CTM4X4S and Wien code are started to separate both effects. Muller [1] showed that changes in bond lengths generate core level shifts and his findings show the same relationship as our results, but the bond length variation and following the energy level shift are reduced approximately by a factor of 10 [2].
[1] Muller D. (1999). Ultramicroscopy 78
[2] Golla-Schindler U., Benner G., Orchowski A., Kaiser U. Microsc. Microanal. accepted
This work was supported by the DFG (German Research Foundation) and the Ministry of Science, Research and the Arts (MWK) of Baden-Wuerttemberg in the frame of the SALVE (Sub Angstrom Low-Voltage Electron microscopy and spectroscopy project.
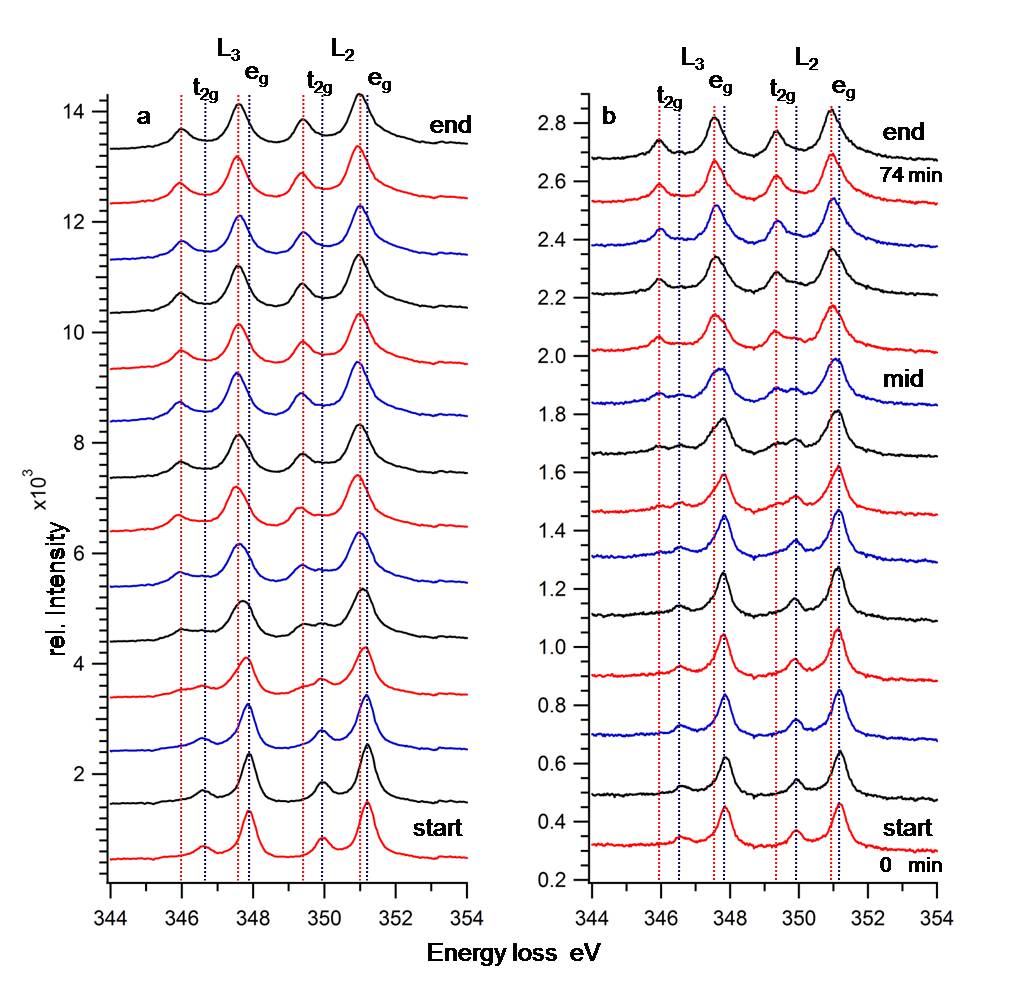
Fig. 1: Figure 1. 40 kV (a) and 20kV (b) EELS spectra (raw data) of the time dependent changes of the Ca-L2,3 edge . The blue dashed lines are aligned to the peak position of the Calcite ELNES and the red dashed lines to the peak positions of CaO ELNES. |