IT-11-P-1784 Accumulation Processing in Reconstruction for Electron Holography
One of the long standing problems affecting electron holography, the lateral coherence limitation, has been solved by using the split illumination method with a specially customized TEM. The customized TEM has one or two biprisms in a condenser optical system [1, 2]. Conventional holography TEM, however, does not have any biprisms in the condenser system. The problem, therefore, remains unsolved in practice. In order to solve the problem by using a conventional TEM, an "accumulation processing" method was developed.
Figure 1(a) explains the concept. The target sample is in the object region (n) far from the specimen edge, and the distance from the region (n) to the vacuum region (ref) exceeds the coherent length R. The first hologram is recorded with two waves in region (n) and region (n-1); the second hologram is also recorded with these waves but in regions (n-1) and (n-2). The specimen is shifted perpendicular to the hologram through a distance W that is equal to the hologram's width. The last hologram is recorded with the waves in region (1) and the reference region (ref).
The reconstructed phase distribution Δηn is described as the difference between the phase distributions ηn of the waves: Δηn = ηn-ηn-1. After reconstruction of all of the holograms, the reconstructed phase distributions are summed one by one, i.e., ΣΔηn =Σ(ηn-ηn-1) =ηn-ηref= ηn. The summed result is the same as the phase distribution reconstructed from the hologram recorded in region (n) and the reference region (ref). This means that the problem is solved in principle.
Figure 1(c) shows a conventional phase map corresponding to the magnetic lines of force from the apex of the magnetic force microscopy (MFM) tip (see Fig. 1(b)). When the hologram width was changed, the density of the magnetic lines of force changed. This means that the magnetic field from the tip leaked into the reference region. Thus, it is important to keep the reference wave far from the magnetic material.
Figure 1(d) shows the phase distribution reconstructed by the accumulation method. All of the regions were reconstructed by using just one reference wave and put in order from (n) to (1). The reconstructed area was seven times as wide as the possible area reconstructed by conventional holography. Accordingly, magnetic lines of force not only from the apex of the tip, but also from other areas can be visualized.
Figure 1(e) shows the subtracted phase distribution processed from (d). A comparison of the results in Figs. 1(c), (d) and (e) clarifies that conventional holography visualizes differentiation of the magnetic field around the tip.
References:
[1] T. Tanigaki et al., Appl. Phys. Lett., 101, 043101 (2012).
[2] T. Tanigaki et al., Ultramicroscopy, 137, 7 (2014).
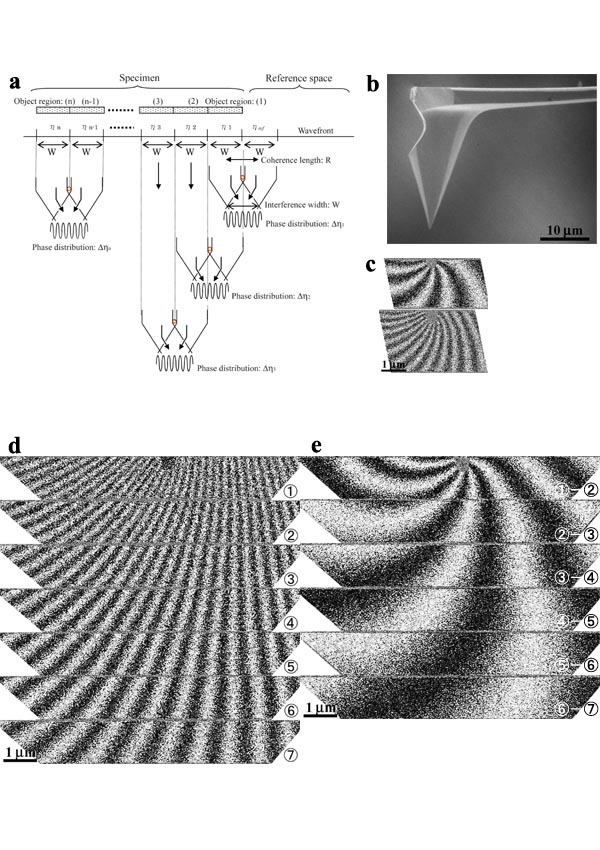
Fig. 1: Fig. 1 (a) Principle of "accumulation processing", (b) SEM image of MFM tip, (c) magnetic lines of force (X 4) from the apex of the tip reconstructed by the conventional method, (d) magnetic lines of force (X 1) around the tip reconstructed by the accumulation method, (e) differential distribution from (d). |