IT-10-IN-1695 Colouring atoms in 3 dimensions
New developments in the field of nanoscience drive the need for 3 dimensional (3D) quantitative characterization techniques yielding information down to the atomic scale. The 3D resolution of electron tomography was recently pushed to the atomic level [1-3]. One approach is based on compressive sensing (CS), a technique specialized in finding a solution with a sparse representation to a set of linear equations. At the atomic scale, the approach exploits the sparsity of the object since only a limited number of voxels is occupied by atoms. The CS technique was applied to the 3D reconstruction of Au nanorods based on only 4 HAADF-STEM images. The crystal lattice of the nanorods was reproduced without prior knowledge on the atomic structure [3]. As shown in Figure 1, also the 3D visualization of crystal defects at the atomic scale is currently possible using the same technique.
Going further than determining the 3D positions of atoms, a crucial aim is identifying the type of individual atoms in hetero-nanoparticles. We recently investigated core-shell Au@Ag nanorods using the CS methodology [4]. A detailed analysis of the position and the atom type was performed using orthogonal slices through the 3D reconstruction (Figure 2). Individual Ag and Au atoms can be distinguished, even at the metal-metal interface, by comparing their relative intensities. These results demonstrate the feasibility of chemically sensitive 3D reconstructions with a resolution at the atomic scale. However, such experiments are experimentally and computationally still far from straightforward and very time consuming.
An alternative approach to resolve the chemical composition of complex nanostructures in 3D is by using energy dispersive X-ray (EDX) mapping. This is a suitable technique for electron tomography since the number of generated X-rays increases with sample thickness. Early 3D EDX experiments were complicated by the specimen-detector geometry [5], but recent efforts enable 3D EDX in an optimized manner [6]. A 3D EDX reconstruction of a Au@Ag nanocube is presented in Figure 3 and clearly illustrates the potential of 3D EDX mapping, but further challenges include extracting quantitative information from such reconstructions.
[1] S. Van Aert, K. J. Batenburg, M. D. Rossell, R. Erni, G. Van Tendeloo, Nature 470 (2011) 374
[2] M.C. Scott et al., Nature 483 (2012) 444
[3] B. Goris, S. Bals, W. Van den Broek, E. Carbo-Argibay, S. Gomez-Grana, L. M. Liz-Marzan, G. Van Tendeloo, Nature Materials 11 (2012) 930
[4] B. Goris, A. De Backer, S. Van Aert, S. Gómez-Graña, L. M. Liz-Marzán, G. Van Tendeloo, S. Bals, Nano Lett. 13 (2013) 4236
[5] G Möbus, RC Doole and BJ Inkson, Ultramicroscopy 96 (2003) 433
[6] P Schlossmacher et al, Microscopy Today 18 (2010) 14
We acknowledge support from the ERC ( “Countatoms-#24691”, and “Colouratoms-#335078”) and the FWO. We thank Prof. Liz-Marzán for providing the samples and useful discussions.
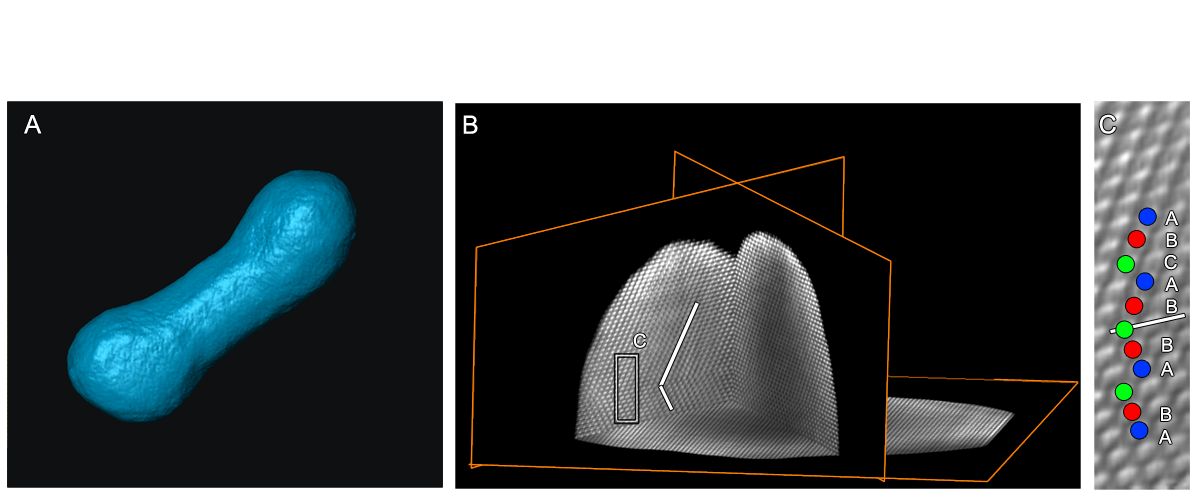
Fig. 1: Fig. 1 (a) 3D reconstruction of a Au nanodumbbell. At the tip, twin boundaries are present. (b) Orthogonal slices through the reconstruction of the tip of the nanodumbbell, presented in more detail in (c) enable one to determine the stacking across the twin boundary. |
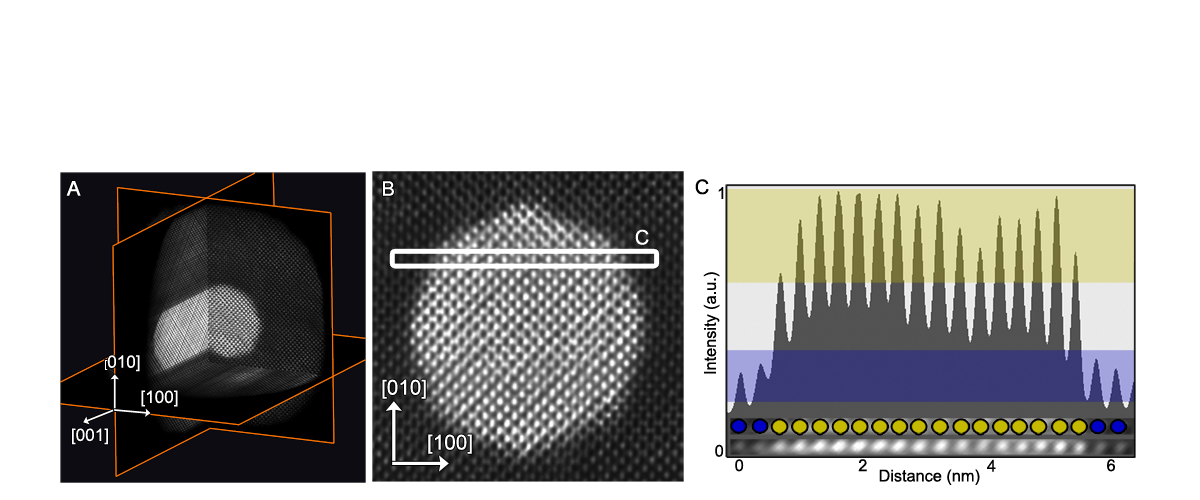
Fig. 2: Fig. 2 (a) Orthogonal slices through the reconstruction show the core-shell structure of the nanorod (b) Detailed view of a slice through the reconstruction perpendicular to the major axis of the nanorod (c) Intensity profile acquired along the direction indicated in (b), showing the capability to assign each atom to be either Ag or Au. |
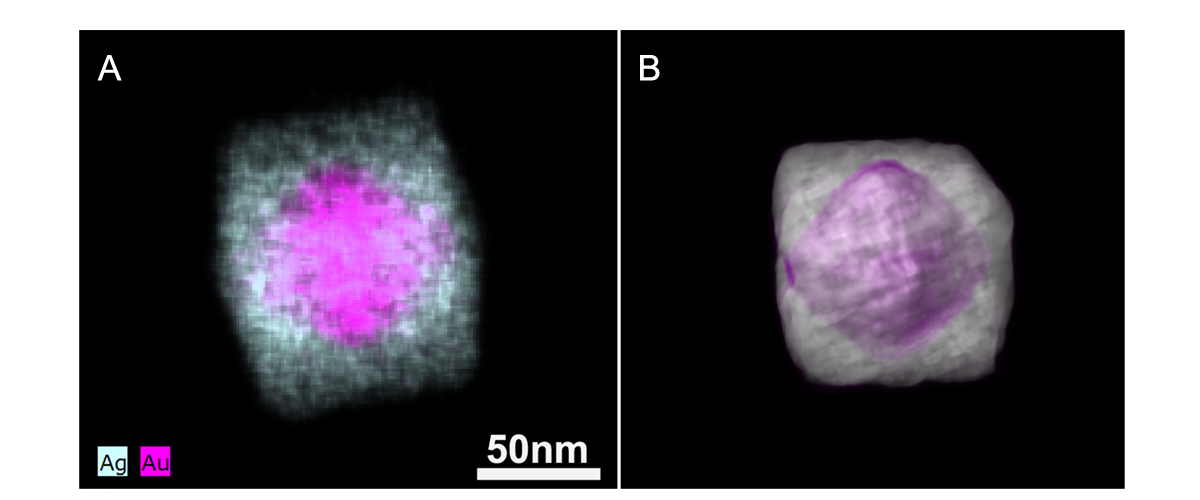
Fig. 3: Fig. 3 (a) 2D EDX map of a Au@Ag nanocube. A tilt series of these 2D EDX maps was acquired and a 3D reconstruction shown in (b) could be obtained. |
|