IT-10-P-1681 Quantitative 360° electron tomography analysis of mesoporous hematite nanoparticles
Metal oxide nanomaterials find application in diverse fields of research and industry such as catalysis, drug delivery, sensing, photo-electrochemistry, optical detection or as pigments [1,2].
The materials properties and hence application performance are affected by the particle size, shape, surface characteristics as well as by possible pore or defect structures. Tuning the parameters of the chosen synthesis technique can affect some or all of these properties and thus enables the tailoring of the particle function.
Here, wet-chemically synthesised mesoporous hematite nanoparticles (NPs) are investigated regarding their internal re-organization during calcination. Scanning electron microscopy (SEM) and transmission electron microscopy (TEM) studies showed that the calcination temperature has a pronounced effect on the pore morphology although a quantitative evaluation of the size distribution and connectivity of the pores was not possible (Fig. 1). Therefore, we carried out a detailed study using electron tomography (ET) in scanning TEM (STEM) imaging mode (enhanced mass-thickness contrast) in order to reveal the three-dimensional morphology, size distribution and interconnectivity of the pores inside the hematite NPs (Fig. 2 b,c,d). NPs in aqueous solution were directly drop-casted onto a pillar with an electron-transparent thickness that has been preliminarily thinned using focused ion beam (FIB) milling. Transferring this tip (Fig. 2 a) onto a 360° ET sample holder enables the acquisition of a tilt series with full tilt-angle range (Fig. 2 b). This permits the reconstruction of the particle morphology without a missing wedge of information and therefore improves the quality of the 3D reconstruction.
The tomograms were used to perform a quantitative analysis of the pore space. Virtual capillary condensation (VCC) [3] and maximum sphere inscription (MSI) [4] were applied to determine the pore size distribution of NPs as illustrated for one particle in Fig. 3. The results are compared with independent N2 sorption measurements. NPs calcined at lower temperatures tend to have a more open-porous structure with a higher degree of porosity, whereas with increasing temperature fewer and rather enclosed pores were found to occur more frequently.
The quantitative analysis of the pore morphology using 360° ET will help to get a better understanding of this promising class of material.
1. Wang et al., New J. Chem. 38 (2014), pp. 46.
2. Echigo et al., Jr., Am. Mineral. 98 (2013), pp. 154.
3. Štěpánek et al., Colloids Surf., A 300 (2006), pp. 11.
4. Novák et al., Chem. Eng. Sci. 65 (2010), pp. 2352.
DFG Research Training Group 1161, Cluster of Excellence “Engineering of Advanced Materials” (EXC 315), DFG SPP 1570, Czech Science Foundation (GACR P106/10/1568).
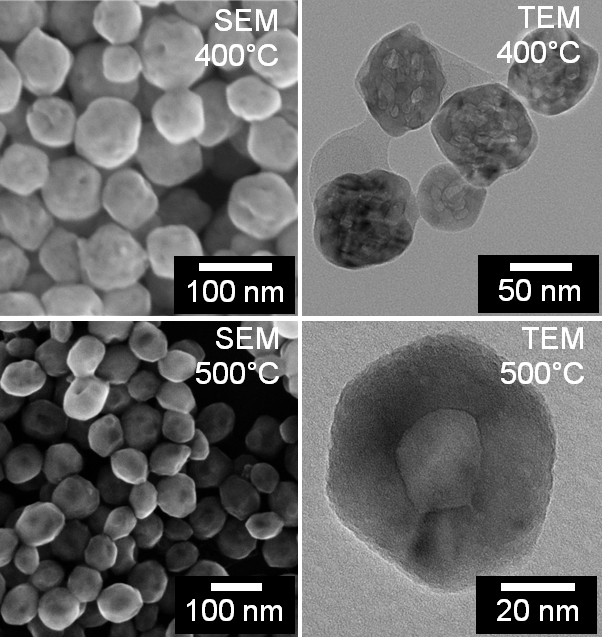
Fig. 1: a) SEM and TEM images of hematite nanoparticles calcined at 400°C and 500°C. |
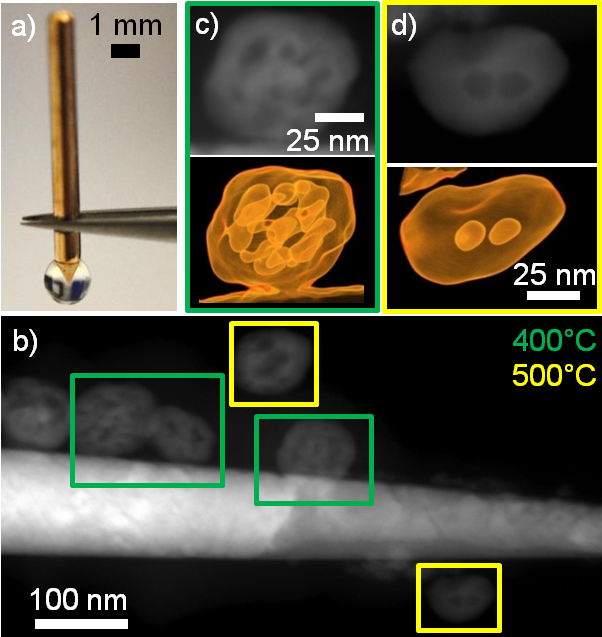
Fig. 2: a) Photo of a 360° ET tip with a droplet of hematite particles in solution; b) STEM image of Fe2O3 nanoparticles attached to this tip - green frames tag particles calcined at 400°C, yellow frames at 500°C; c), d) comparison of STEM images and the 3D reconstruction (volume rendering) of c) 400°C and d) 500°C particles. |
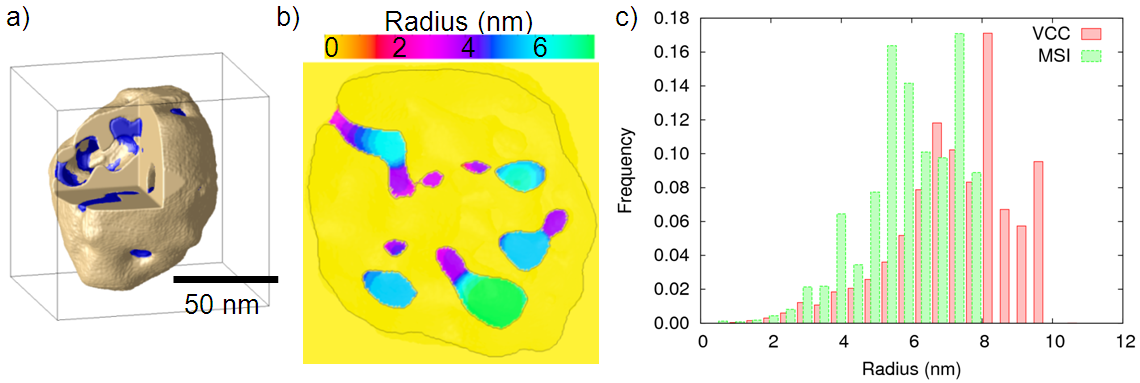
Fig. 3: Reconstructed hematite nanoparticle calcined at 400°C showing a) a snapshot of the virtual capillary condensation (VCC) [3] (pores gradually filled with liquid (blue)), b) a slice displaying colour-coded results from the MSI analysis [4]; c) diagram showing the pore size distribution resulting from the MSI analysis and the VCC simulation. |
|