IT-5-P-1605 Comparisons on Energy and Wavelength Dispersive X-Ray Spectrometry Microanalytical Results: First Approach Based on Iron Ore Sinter Phases
Microanalyses of iron ore sinter constituents — hematite, magnetite (Mag), silicoferrite of calcium and aluminium (SFCA) and silicates — are particularly important to handle their impurities. For this reason, these phases need to be well-studied in characterization researches and this had been done for sinters produced with iron ores from Quadrilatero Ferrifero Mineral Province (MG – Brazil). Prior researches had included many qualitative/semiquantitative microanalyses processed by an energy dispersive system (EDS) on a thermo-ionic scanning electron microscopy (SEM). In order to compare different microanalytical approaches and spectrometric devices, which is the main concern of this work, two of these sinter phases have been chosen: SFCA, a typical phase of these sinters, and Mag. At this time, a field emission gun SEM has been employed to acquire qualitative/semiquantitative analyses as much as quantitative ones. In the latter, standards were used. In the same way, a microprobe with wavelength dispersive spectrometers (WDS) was also applied, using similar standards. In a first remark, the relative behavior among the major elements constituents of these phases was retained in spite of the applied method. However, some differences can be highlighted. For SFCA (fig. 1), a similar trend has been observed for a same element, but each one has its proper behavior. Considering all applied spectrometry devices and elaborating the assessment of microanalyses from one sample, some aspects have been observed: Fe stated as Fe2O3 occurs close to 60wt% and inferior to 90wt%, as a rule between 70-85wt%; Ca usually varies near to 10-15wt% of CaO; Si ranges from 3 to 6wt% of SiO2, reaching either higher contents like 8wt% or lower ones as 2wt%; Al commonly achieves 2-4wt% of Al2O3; Mg as major element ranges between 1-2wt% of MgO; in minor quantities, it is close to 1wt% of MgO. For magnetite, a similar trend was also observed for a same element: Fe quantified as Fe2O3 vary from 87 to 97wt% (all spectra), for all devices. For the other elements: SiO2 extends from almost 0.0 to 1.2wt%; Al2O3 varies from 0.5 to 2.0wt%; CaO reaches values from 0.5 to 1.7wt% and MgO achieves contents between 2.5- 9.5wt%. In Mag, Si, Al, Ca and Mg are impurities. Even though diverse behaviors have been observed, it is possible to reproduce the composition of SFCA and Mag with a relative similar evaluation regardless of the applied method, revealing that all types of microanalyses (EDS and WDS) represent the behavior of the discussed elements. In the following steps, the number of microanalyses will be enlarged aiming the validation of this first assessment and to ensure the most appropriate system to understand the phases and related individual requests.
We are grateful for the infrastructure of the Center of Microscopy and of the Microanalyses Laboratory of Department of Physics, both institutions from UFMG.
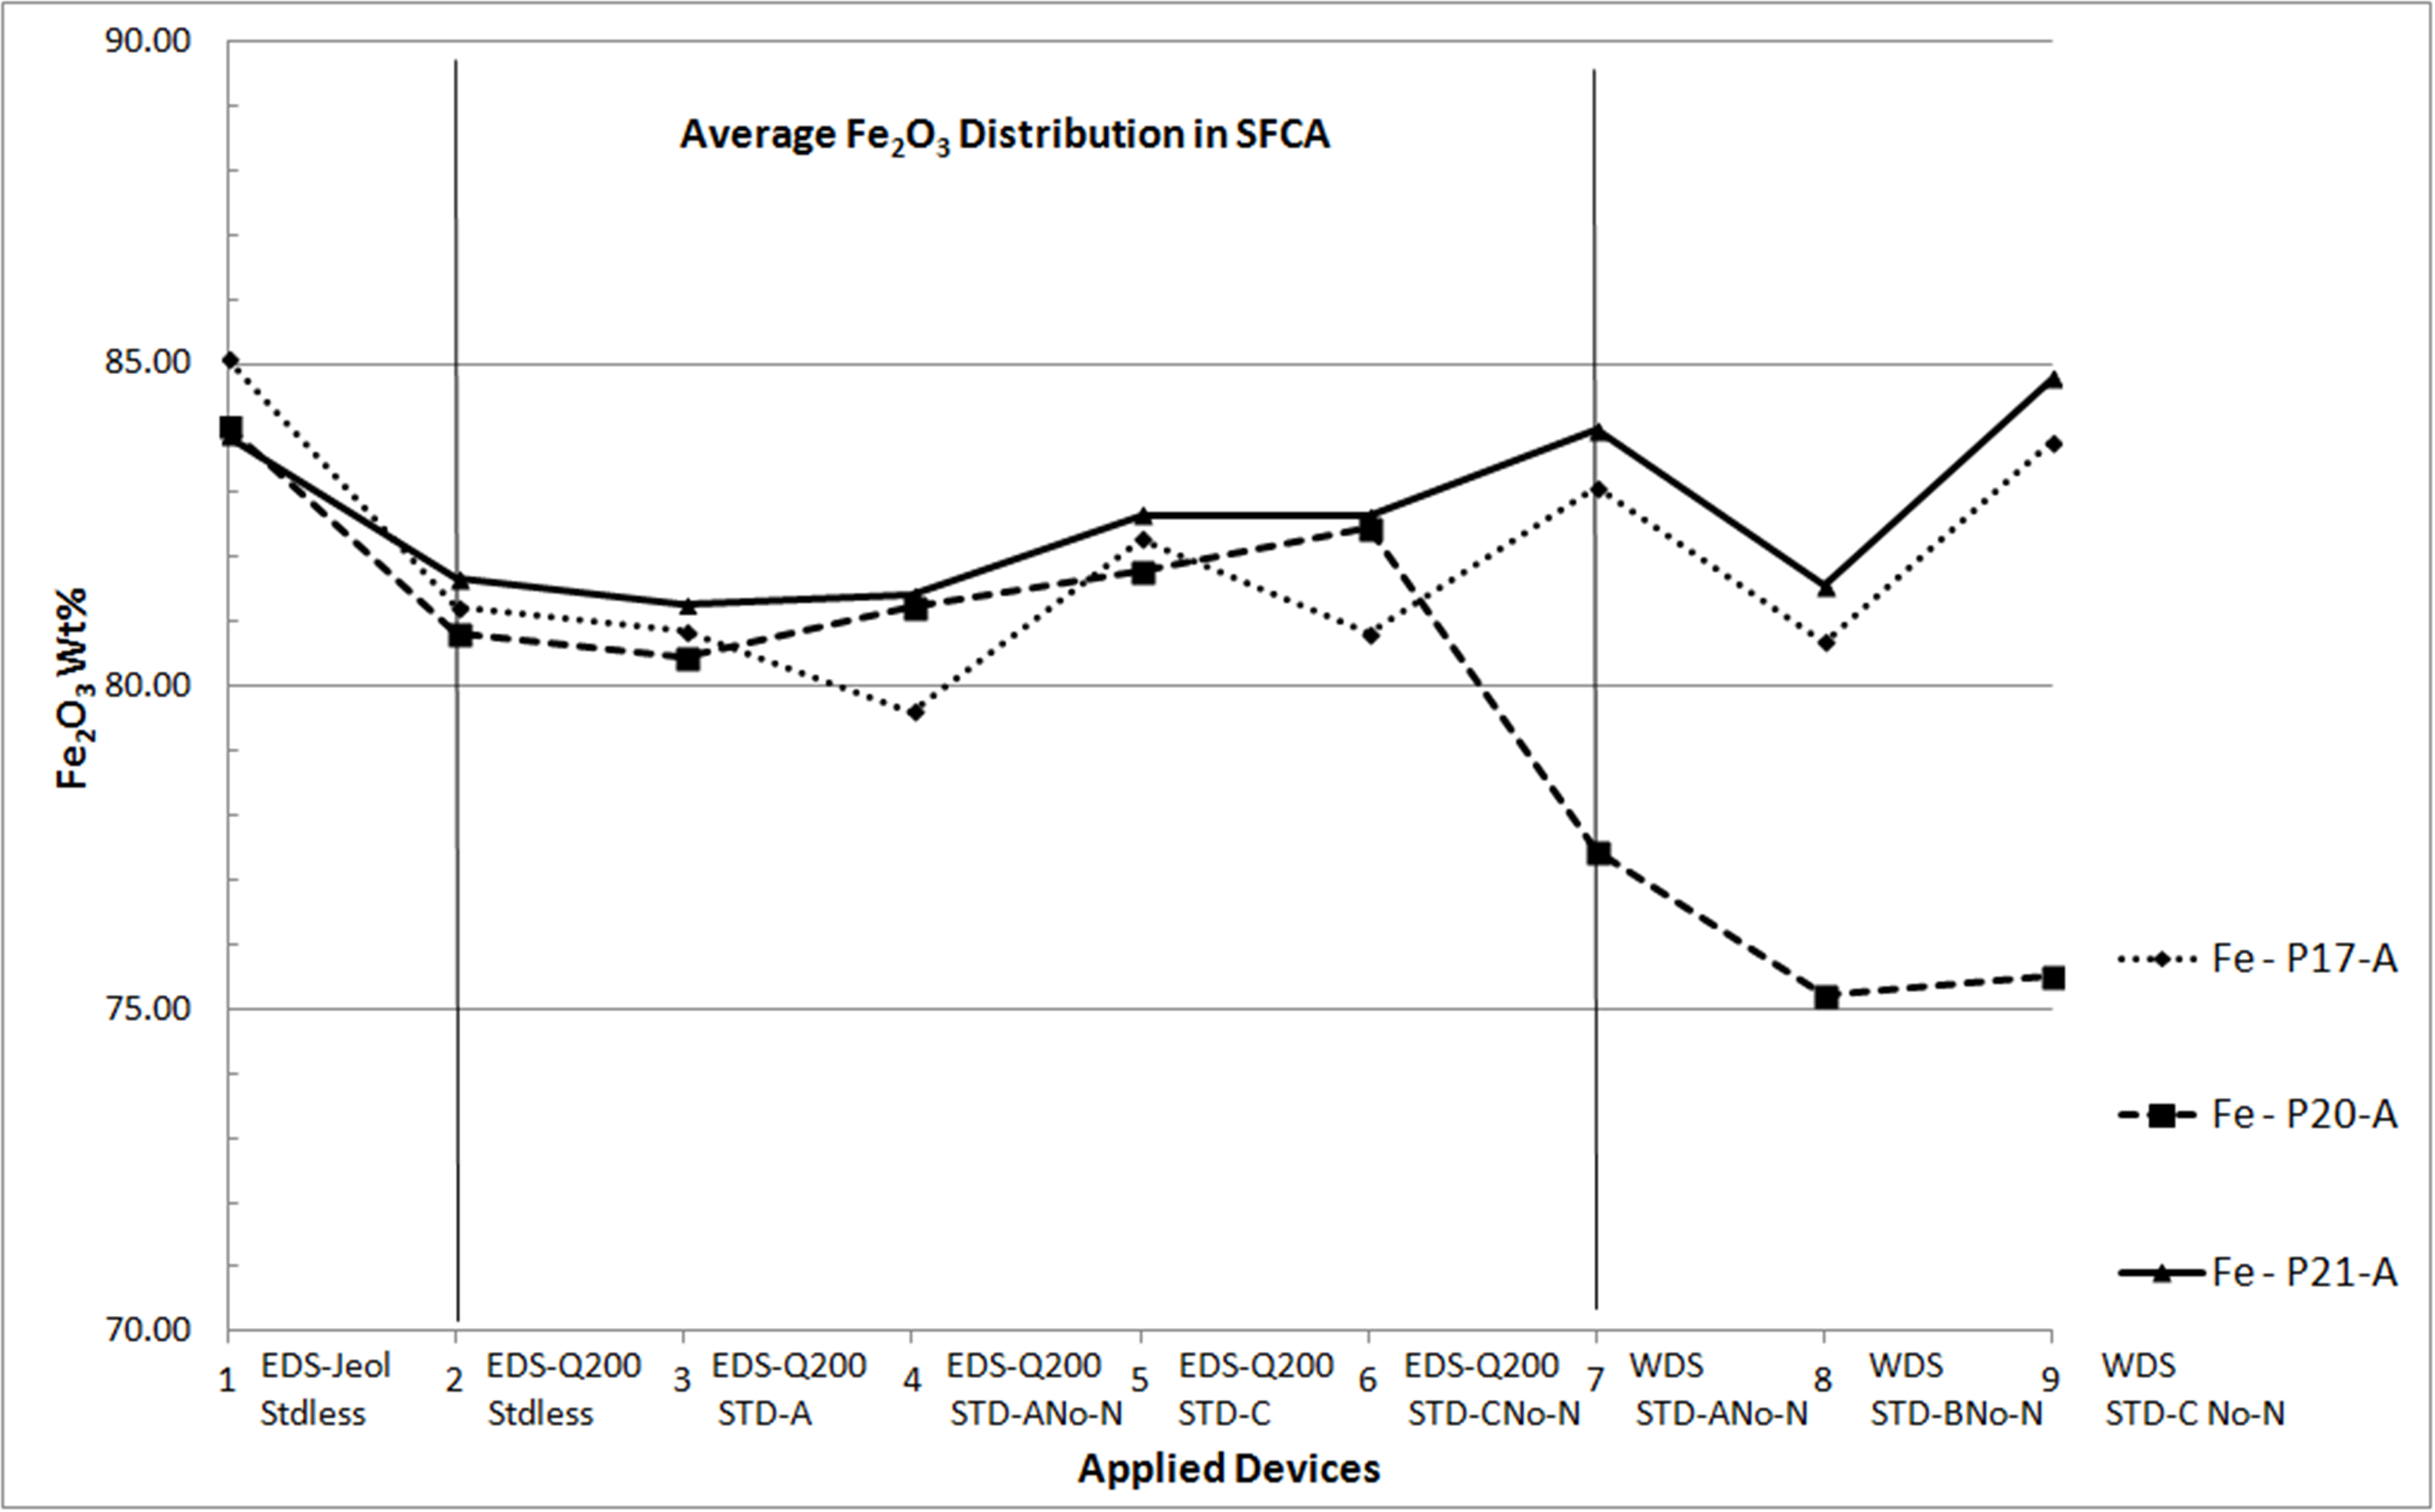
Fig. 1: The diagram shows Fe2O3 mean distribution in some portions of SFCA, a typical iron ore sinter phase, considering EDS and WDS devices. Stdless: Standardless; STD-A: General Standard; STD-B: Particular Standard for SFCA; STD-C: Particular Standard for Magnetite; No-N: no-normalized. |
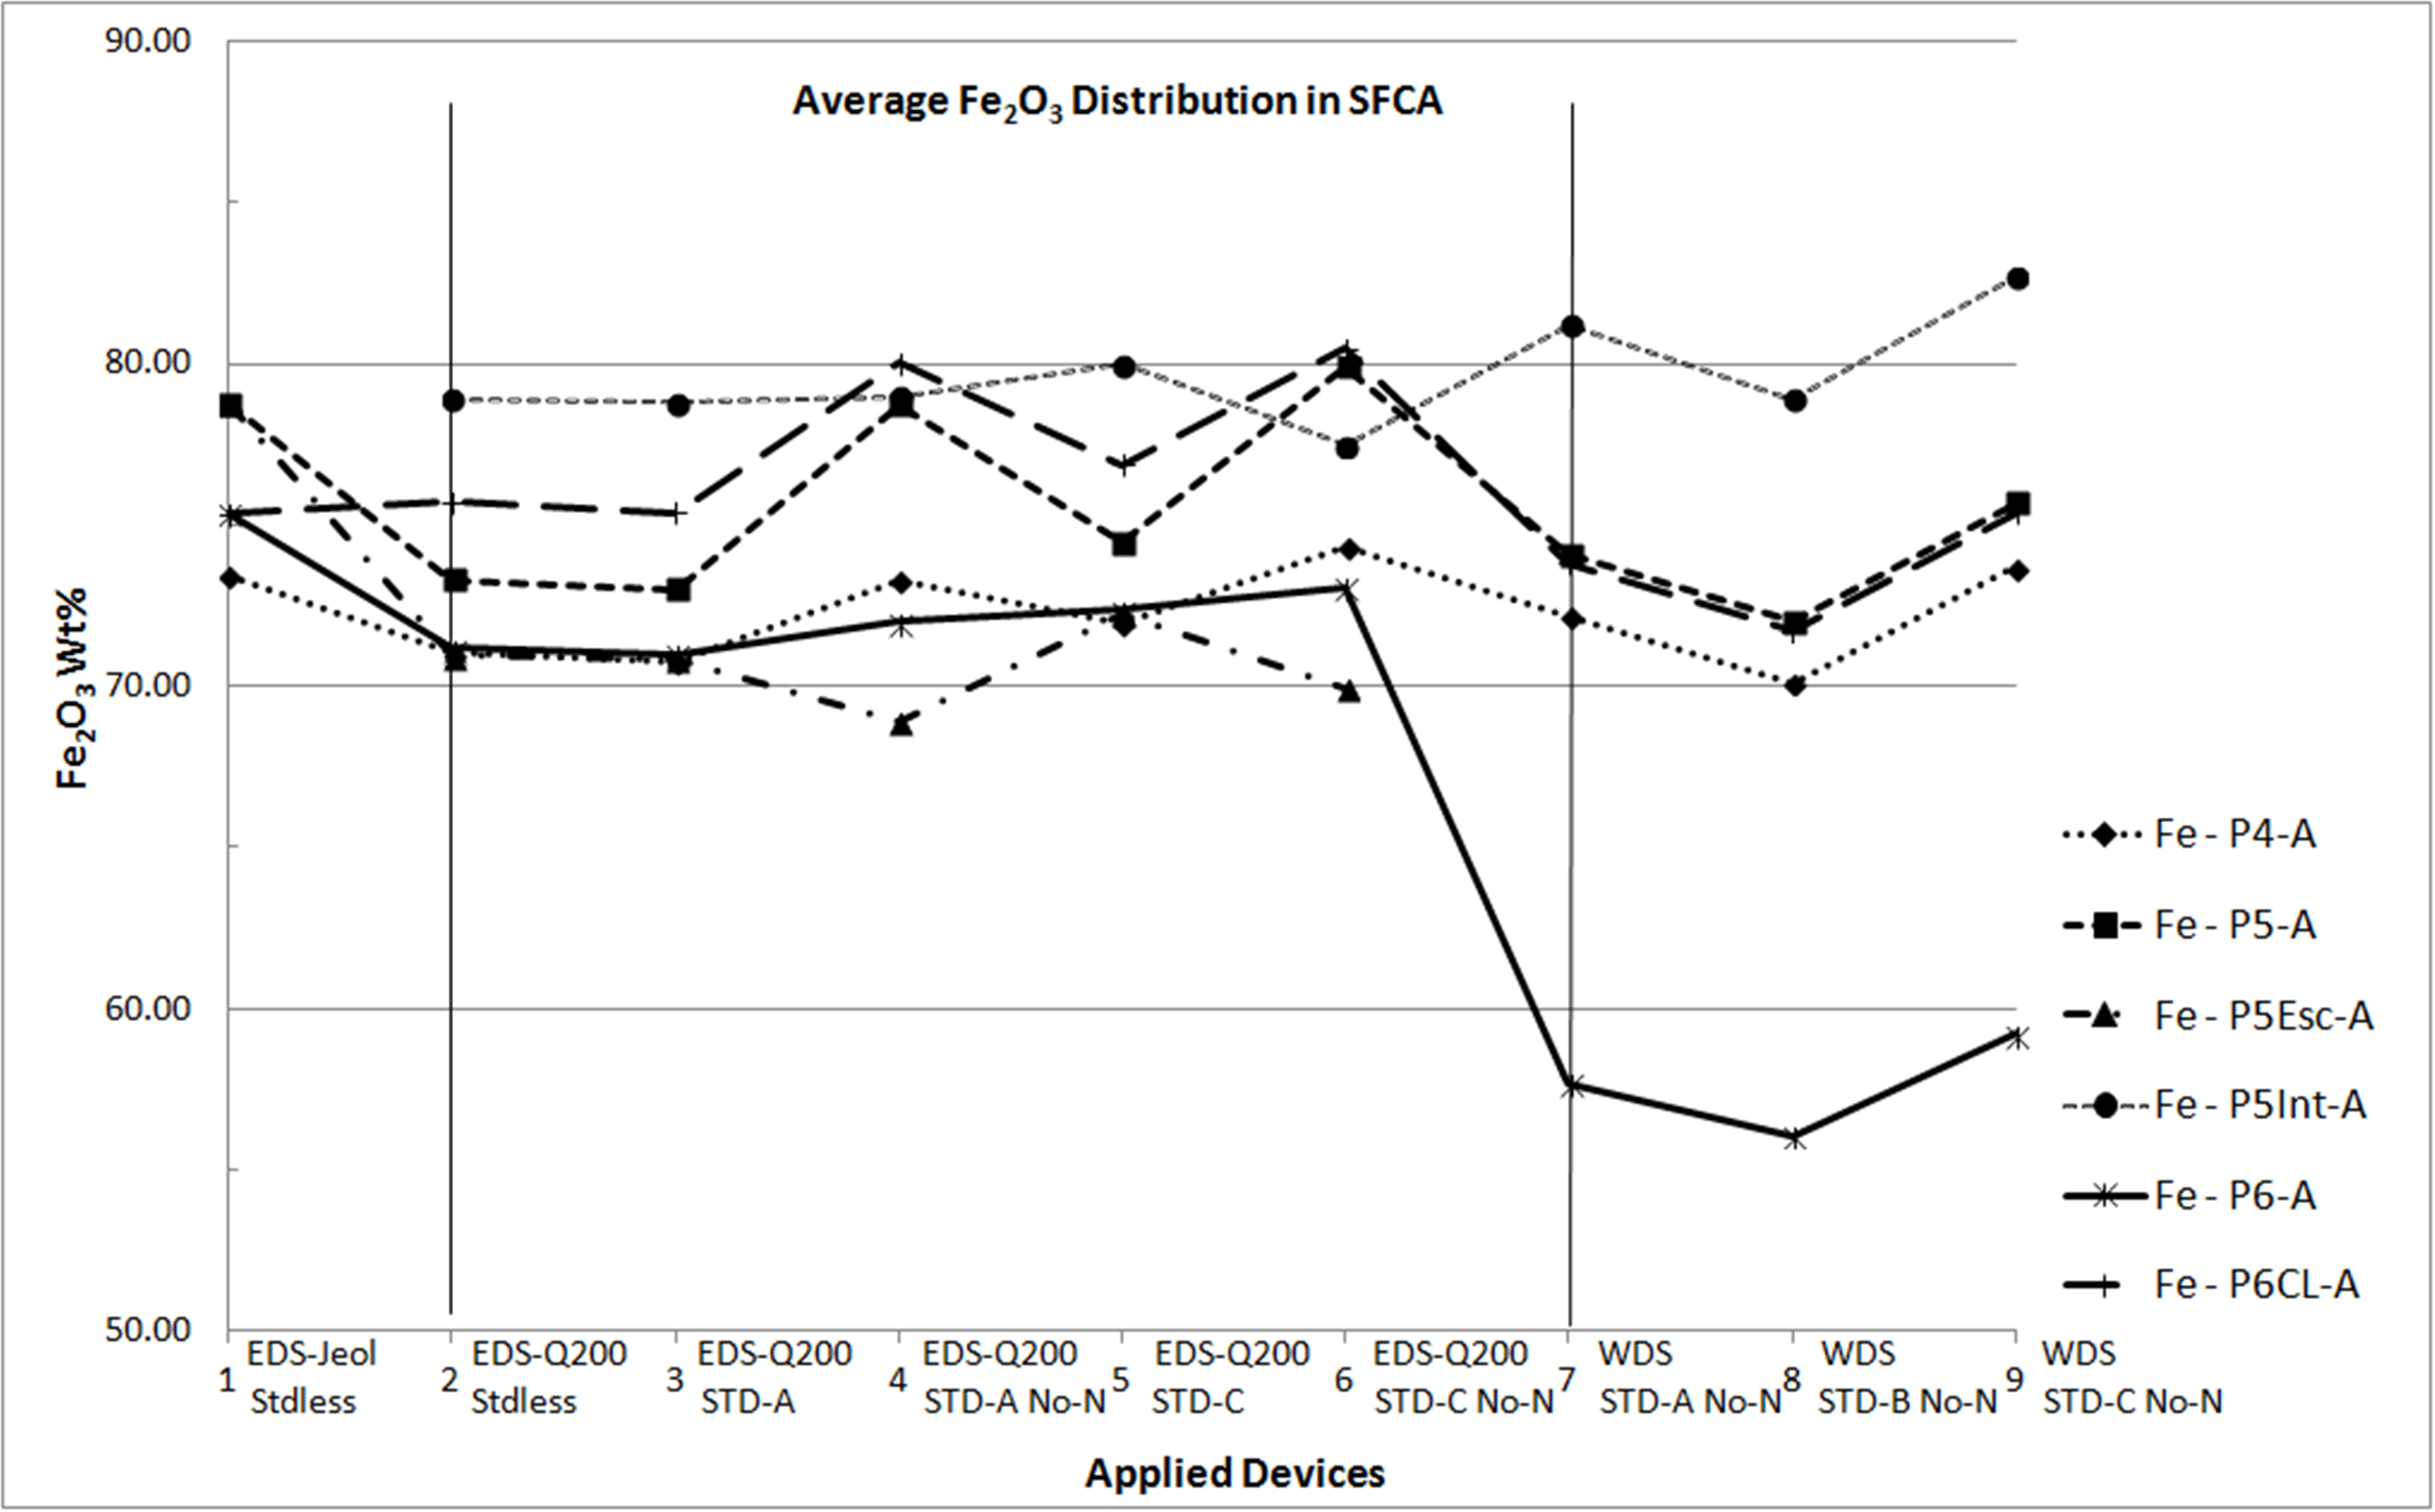
Fig. 2: Other diagram showing Fe2O3 mean distribution in some portions of SFCA, a typical iron ore sinter phase, considering EDS and WDS devices.Jeol: JSM-5410 thermo-ionic SEM with a NORAN TN-M3055 spectrometer; FEI Company: Quanta-200 (Q200) FEG SEM with an EDAX Sapphire Si(Li) spectrometer; Jeol: JXA 8900R microprobe with four WDS spectrometers. |
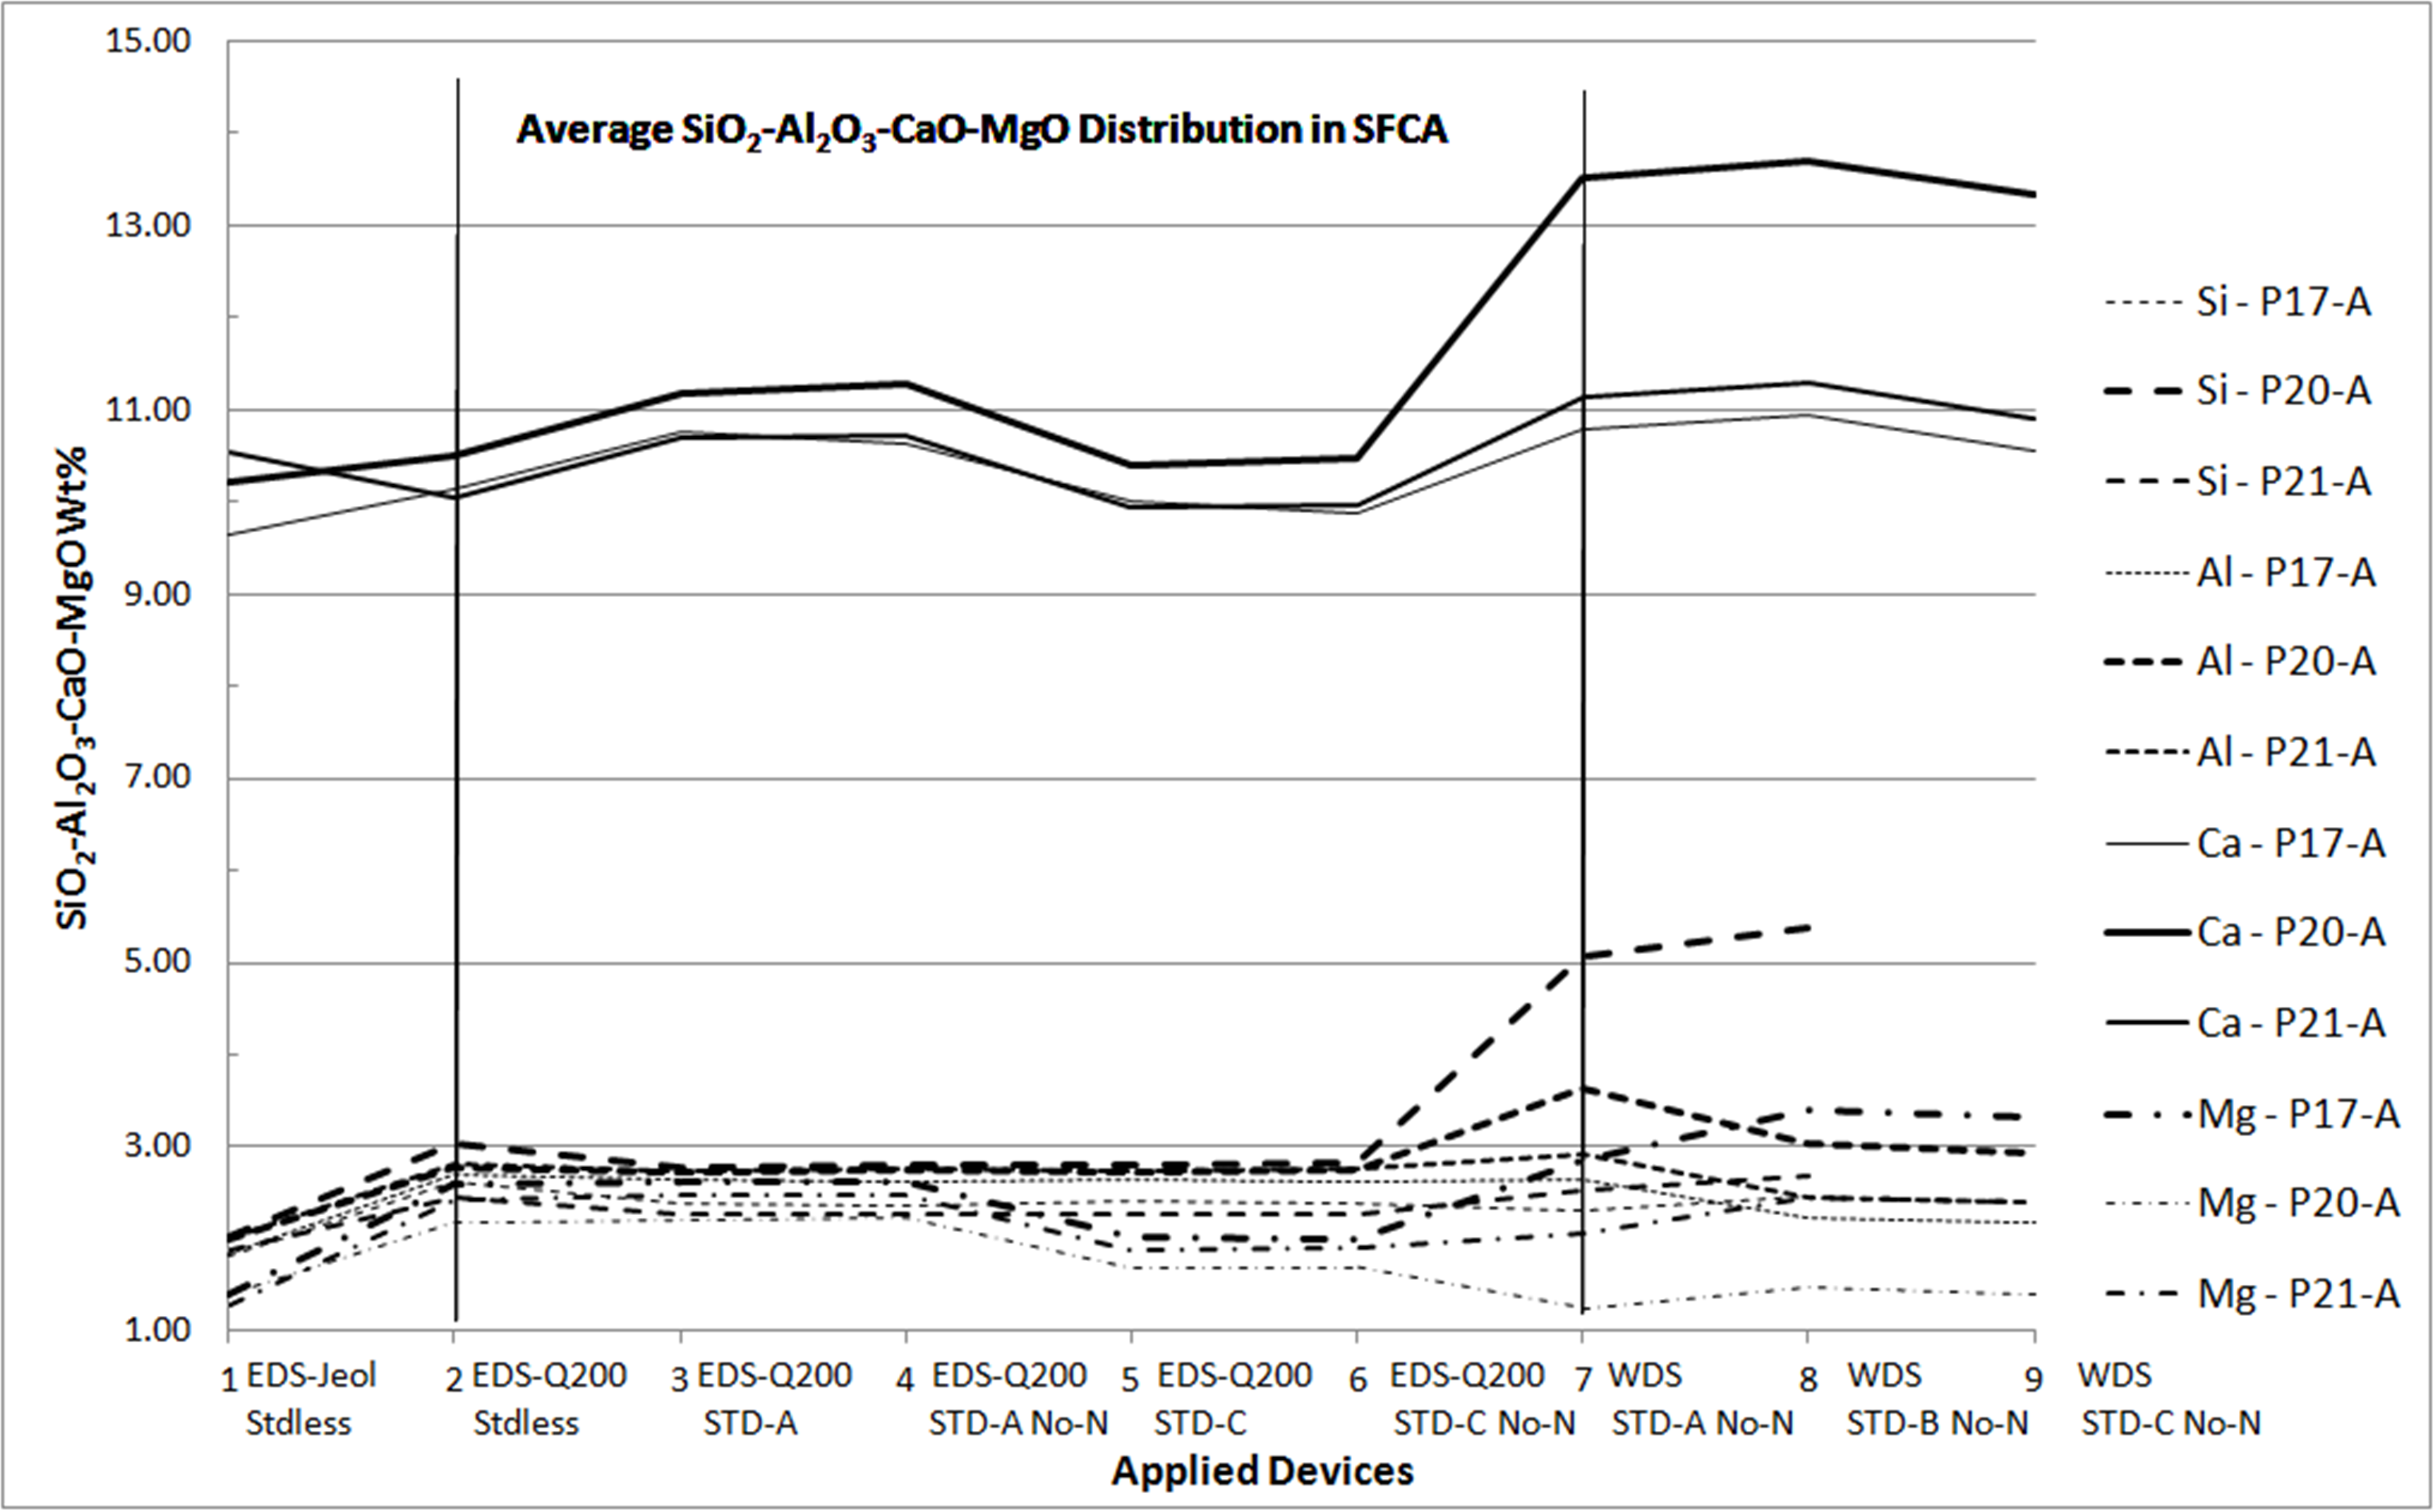
Fig. 3: The diagram shows the elements mean distribution in some portions of SFCA, a typical iron ore sinter phase, using EDS and WDS devices. The elements are stated as oxides - SiO2; Al2O3; CaO; MgO. See figure captions on figures 1 and 2. |
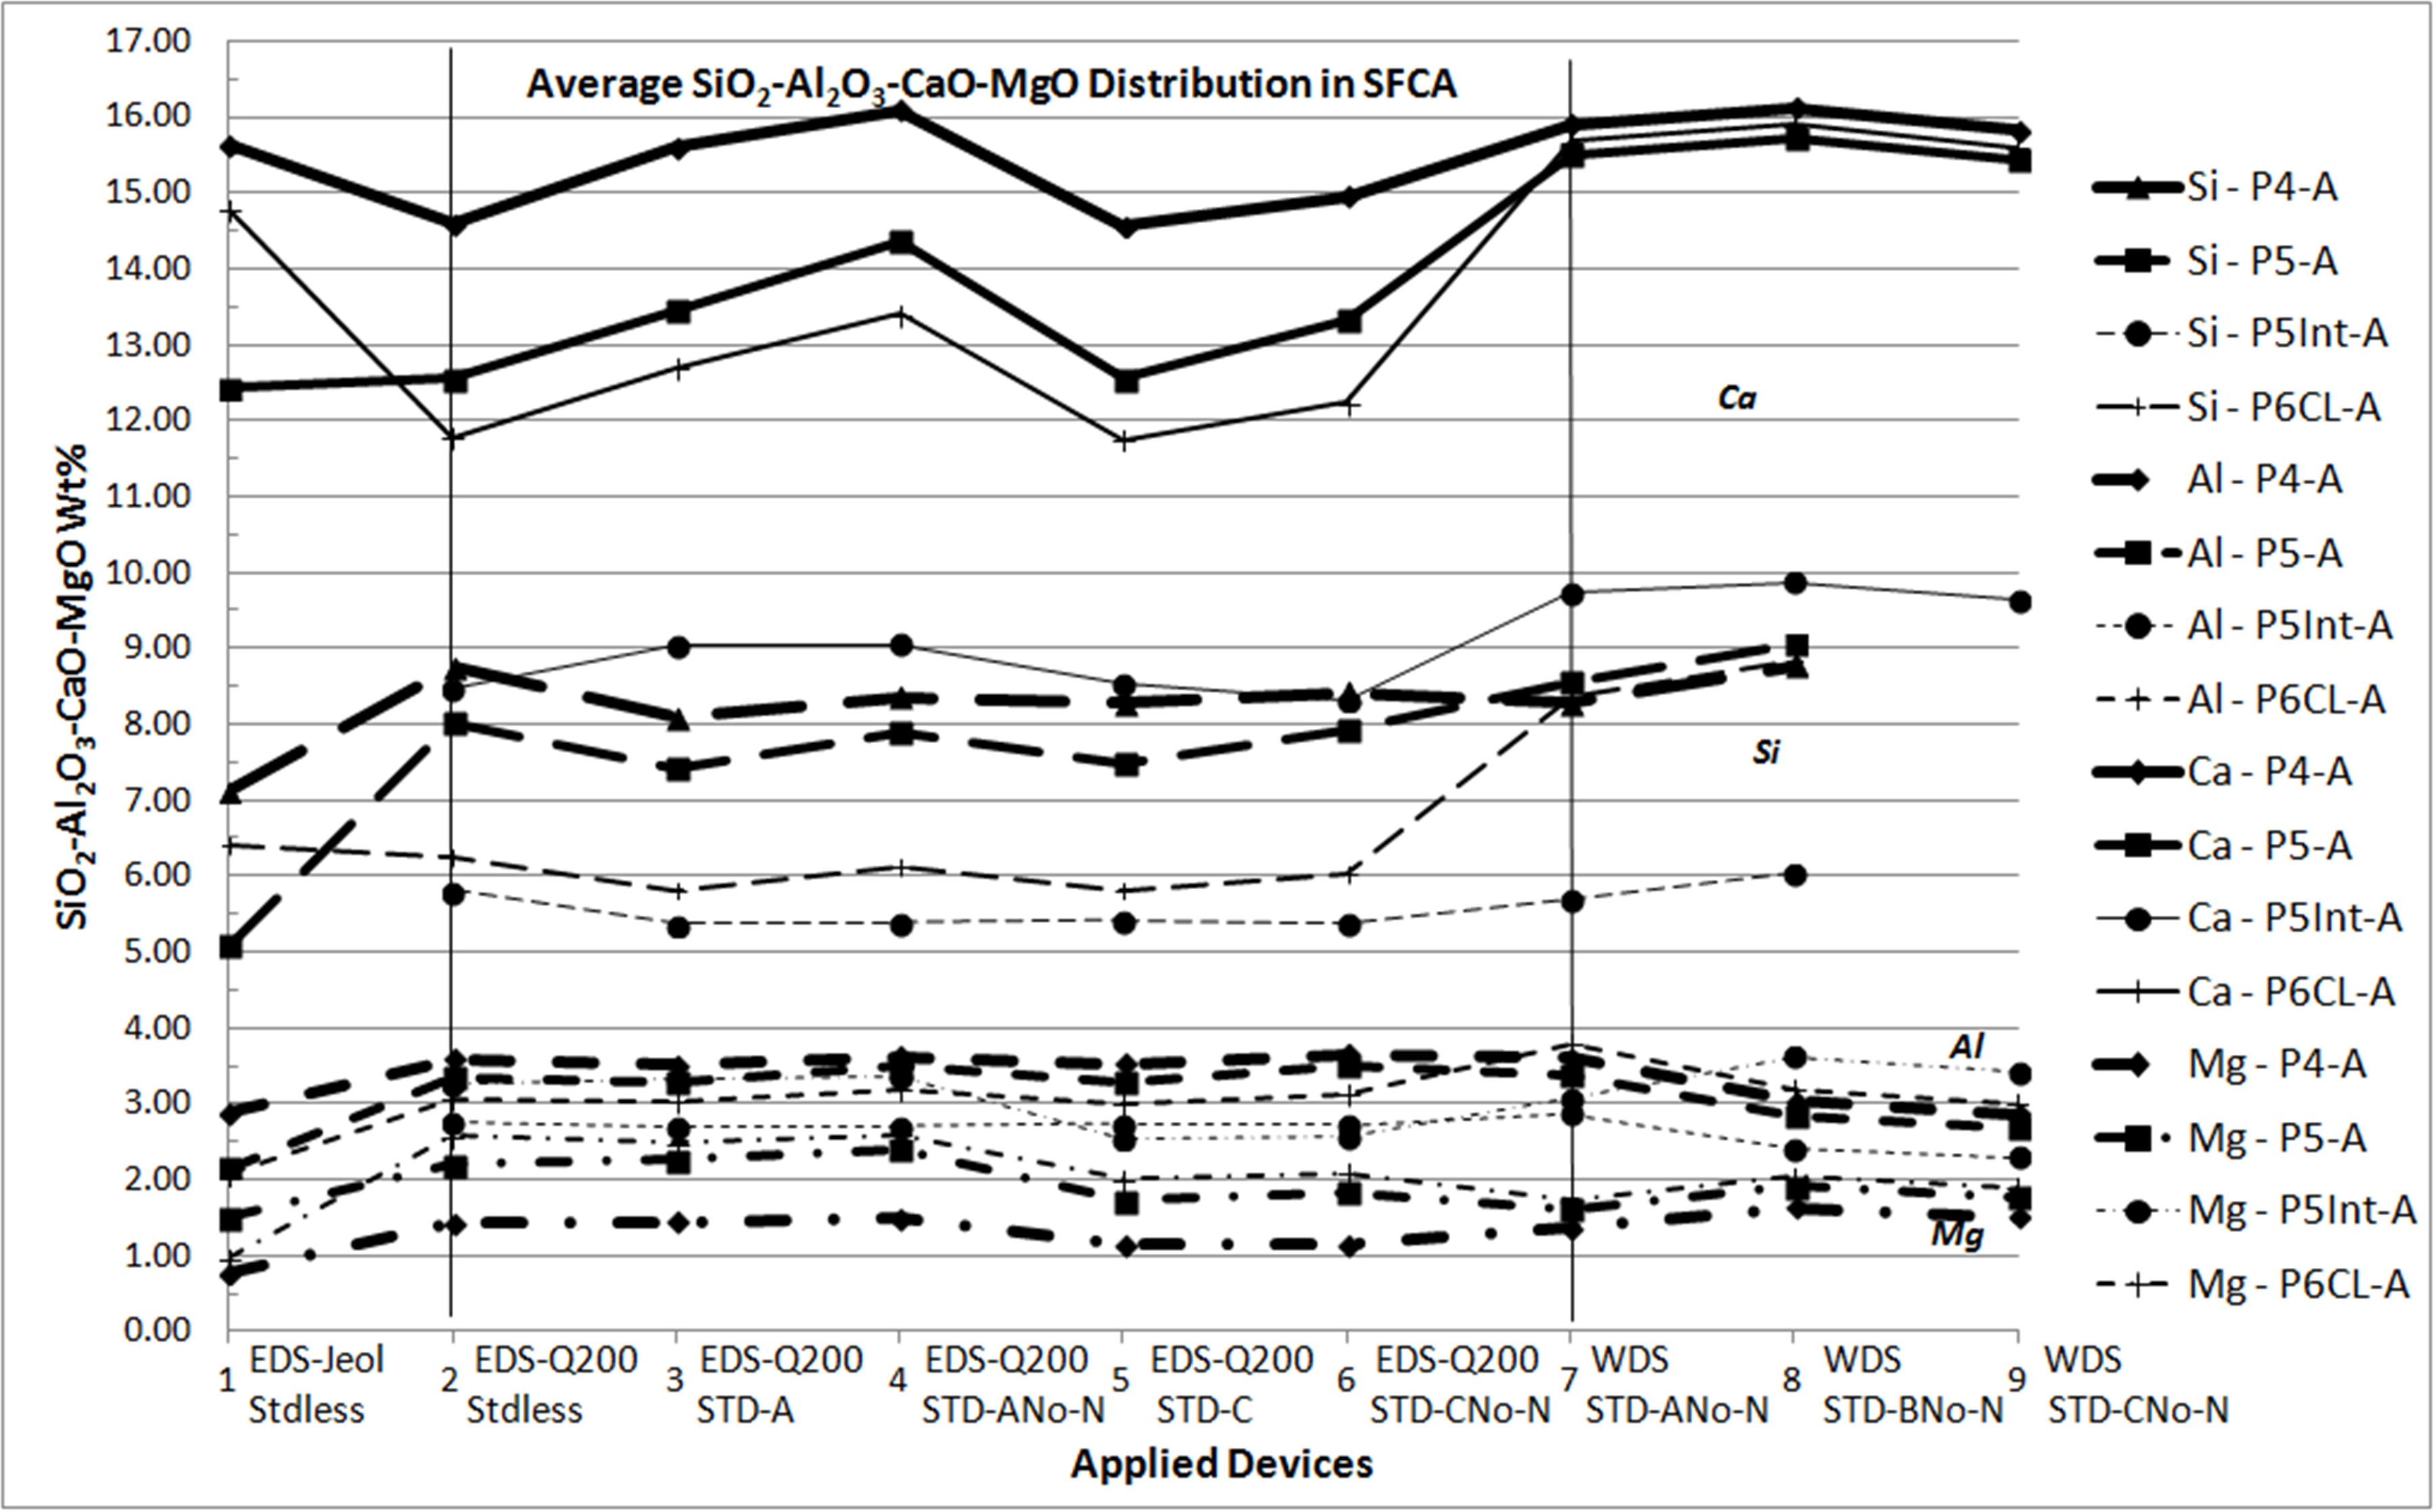
Fig. 4: Other diagram showing the elements mean distribution in some portions of SFCA, a typical iron ore sinter phase, using EDS and WDS devices. The elements are stated as oxides - SiO2; Al2O3; CaO; MgO. See figure captions on figures 1 and 2. |