IT-9-P-1563 Nano-beam Diffraction of Pt/Al2O3 and Pd/Al2O3 Catalysts
Pt-Al2O3 and Pd-Al2O3 catalysts are used in a wide range of applications including automobile emissions catalysts (1, 2). Although there have been many studies on this system, there are few studies which examine in detail the nanoparticle interface with the complicated nature of γ-Al2O3 and its associated polymorphs. Commercial Pt-Al2O3 and Pd-Al2O3 catalysts tend to be composed of small metal nanoparticles (< 10 nm) on high surface area Al2O3, which are often agglomerations of 10-30 nm crystallites. SAD analysis of such catalysts rarely provides quantitative crystallography of individual Al2O3 crystals but nanobeam diffraction (NDB) has been shown to be a useful tool for examining individual small crystals (3). The nano-sized probe, combined with nanosize crystals has been shown to produce well defined shape effects in the diffraction pattern which can provide further structural insights compared to images alone (4). Here, we have used nano-beam diffraction to investigate how this technique can provide useful insights into the structural relationships between the nanoparticles and the Al2O3 support.
A double aberration corrected JEOL 2200FS was used for this study. The catalysts were provided by Jonhson Matthey as powders. (S)TEM specimens were prepared by depositing an ethanol suspension of the powder onto a holey-C film Cu TEM grid.
Figure 1 shows a typical SAD pattern of an agglomeration of many Pd nanoparticle coated Al2O3 crystals. The bright rings are the {400} and {440} rings assuming γ-phase. The related θ and δ phases have similar bright spatial frequencies but are indexed differently. From the SAD pattern in Figure 1, no useful information can be extracted from it regarding the phase of individual Al2O3 crystals and the nanoparticles supported on them. Figure 2 shows NBD pattern of an individual Al2O3 crystal. The NBD pattern was taken with a probe of approximately 2 nm in diameter. The convergence angle of the probe in this case is sufficiently small to produce a diffraction pattern composed of well defined points rather than discs. The diffraction pattern shows well ordered spots of γ-Al2O3 in [110] orientation. Diffraction patterns such as this from the support and a nearby nanoparticle provide insights into the structural relationship between the two. Where it is applicable, for quantitative analysis the method is clearly superior to FFTs of images in terms of the effects of SNR, aberrations and drift etc and in not requiring an exact zone axis orientation.
References
1. A. Russell, W. S. Epling, Catal Rev 53, 337 (2011).
2. O. K. Ezekoye et al., J Catal 280, 125 (May 16, 2011).
3. M. R. Ward, T. Hyde, E. D. Boyes, P. L. Gai, Chemcatchem 4, 1622 (Oct, 2012).
4. F. Tao et al., Science 322, 932 (Nov 7, 2008).
The authors thank the EPSRC for support from critical mass grant EP/1018058/1.
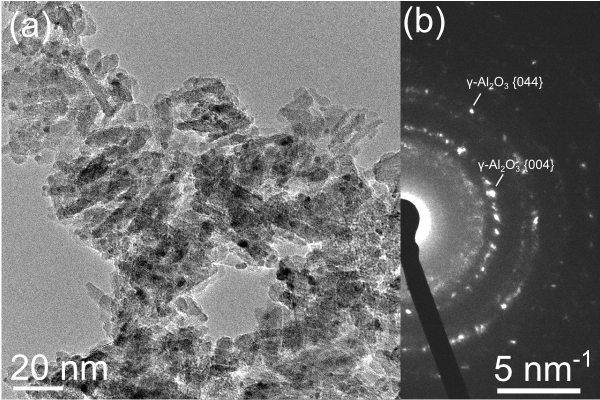
Fig. 1: (a) TEM image and (b) SAD pattern of the Pd-Al2O3 catalyst. The SAD pattern rings are not useful for indentifying the phase of individual Al2O3 crystals. |
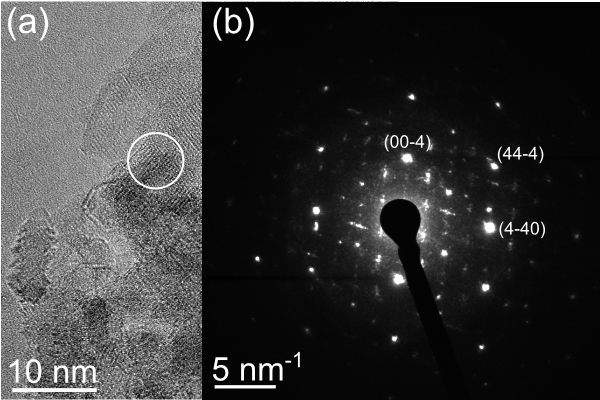
Fig. 2: (a) TEM and (b) NBD pattern of a single crystal (indicated) in the Pd-Al2O3 catalyst with (b) being identified as γ-Al2O3 |