IT-5-P-1543 Optimizing spatial and energy resolution in the TEM at low dose - Lateral Resolved EELS of organic bulk heterojunctions
The morphology of organic bulk heterojunction (BHJ) solar cells is strongly correlated to the efficiency of the device [1]. To improve device performance, knowledge of the nanoscale morphology is thus essential. We implement a novel analytical method using Energy Filtered Transmission Electron Microscopy (EFTEM), which allows visualization of donor and acceptor materials in these thin films by analyzing electronic excitation features in the optical and plasmonic electron energy loss region.
Segmentation by Electron Energy Loss Spectroscopy (EELS) reveals that the carbon based organic photovoltaic materials show characteristic optical excitations in energy-loss spectra. However, the blend materials are very sensitive to radiation damage, which impedes also spatial spectral mapping using EELS in conventional scanning beam mode [2].
We introduce an automated scheme which exploits the inherent spatial resolution in the EEL spectrum as it is obtainable from aberration corrected imaging energy filters. It involves automatic scanning of the image of a slit aperture in the illumination beam path. To eliminate residual image distortion in the EEL spectrum we apply additional correction algorithms to facilitate quantitative spectrum interpretation.
Fig. (1a) shows a bright-field image of a polymer:PCBM BHJ and (1b) the spectroscopic image. The polymer-rich areas are represented in green while PCBM-rich areas are red. The slit position during LREEL spectrum acquisition is marked in (Fig. 1a). It was divided into eleven segments from each of which an averaged spectrum was extracted. The acquired spectrum is shown for three segments, in Fig. (2) (electrons are spread horizontally according to energy loss, the zero-loss peak is shown in red) and the averaged spectra from these areas are seen in Fig (3a), (3b) and (3c), respectively. Distinct differences in the spectral information from the different areas are obvious.
The application of such automated laterally resolved EEL spectroscopy (LREELS) as described here allows spatial mapping of high-resolution spectra in two dimensions at low-dose conditions. This is crucial for our understanding of organic BHJ solar cells.
[1] Pfannmöller, M. et al. Nano Lett. 11 (2011) 3099–3107
[2] Egerton, R. F. et al. Micron 43 (2012) 2–7
Financial support by the BMBF (FKZ 03EK3505K, FKZ 13N10794) is gratefully acknowledged.
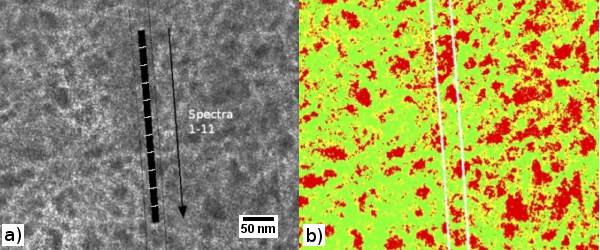
Fig. 1: a) Bright-field image of a Polymer:PCBM BHJ and b) spectroscopic image depicting the polymer-rich areas in green and the PCBM-rich areas in red. LREELS data was acquired using the slit position marked in a). |
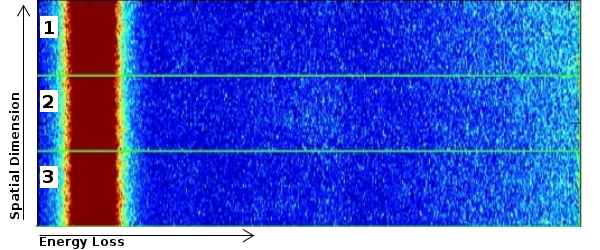
Fig. 2: Recorded spectrum after correlation with the slit position. Of the eleven marked blocks (Fig. 1), three are shown representatively. The zero-loss peak is depicted in red. The energy loss is on the horizontal axis. The vertical direction corresponds to the slit length. |
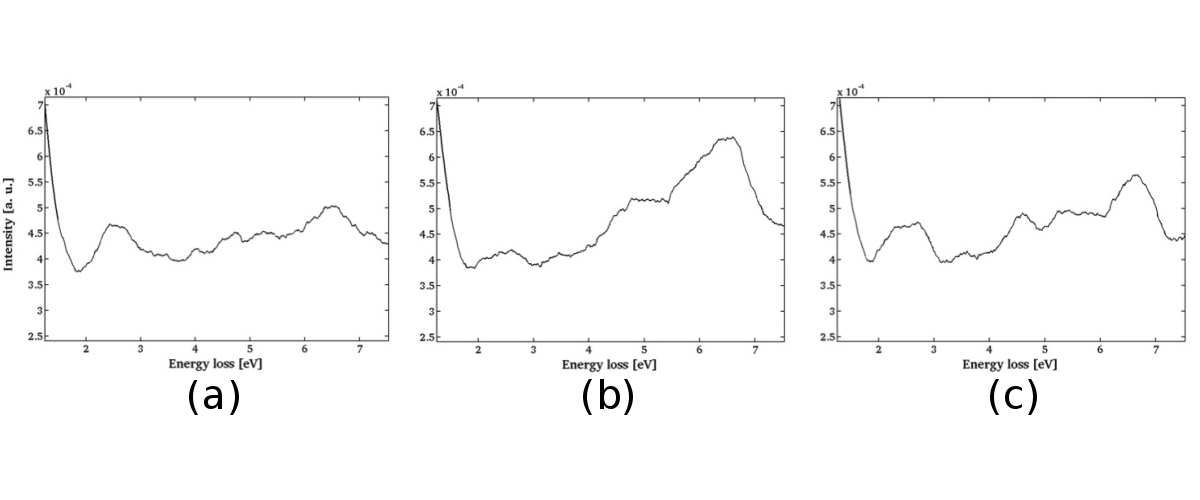
Fig. 3: The averaged spectra from areas 1 (a), 2 (b) and 3 (c) as seen in Fig.2. The spectra from the different areas show distinct differences typical for the materials studied here. |
|