IT-11-P-1535 Strain fields in the vicinity of SiGe nanopyramids evidenced by focus series phase retrieval imaging
Nanoscale characterization is a major issue for the development of nanostructures. Local composition and morphology are at stake as well as strain within the nanoobjects and in the near substrate since strains might be monitoring self organization. While local chemistry can be known using EDS or EELS methods, efforts are still required to determine morphology and strains by TEM. Off axis holography is able to provide such information but remains a quite dedicated technique. Hopefully among the numerous forms of holography, focus series can be used to derive phase image. The advantage of this in line holography is to be easy to carry out in the course of a classical TEM study and to provide phase image on a large scale (up to several microns). The method consists in acquiring images at different defocus (-Δ, 0, Δ) and deriving the phase image using a filtering type processing that realizes the inversion of the phase transfer function.
In the present work, the focus series method has been applied to SiGe nanostructures deposited on a Si substrate. These SiGe nanostructures are expected to have a pyramidal shape and an average composition Si20Ge80. Figure 1 displays the focus series obtained on a plane view sample.Using the image analysis described in (1), phase image with very unrealistic values were obtained while the method had been validated by the measurement of inner potential on gold nanoparticles. Actually it appears that depending on the nanoobject scale, the image analysis may require further optimization. In particular strain fields are long range effect that prevents from applying filters appropriate for a nanoparticle assembly. The filtering process has to be modified: instead of a Gaussian edge filter, a Tikhonov regularisation was applied (i.e. a q2/(q2+a2)2 filter). The phase image (Fig.2) results from this modified filtering. The nanopyramids are characterized by a central positive phase with four lobes of negative phaseshift located at the corners of the pyramids. This negative phase cannot be explained by chemical segregation since the inner potential VGe is higher than VSi but by a strain effect changing the local inner potential. However the relation between strain and phase requires more investigation.
At this point, we wish to emphasize on the phase retrieval method optimization and on the qualitative information like location of strains and the first stages of self organization, namely the striking observation of non-random islands assemblies. This behaviour is representative of preferential nucleation of islands that is now investigated with computations of both total energy and kinetic nucleation barrier as a function of the distance between islands.
(1) P. Donnadieu et al, Applied Physics Letters 94, 263116, 2009
The French CNRS-CEA network METSA is acknowledged for providing the access to TEM facilities
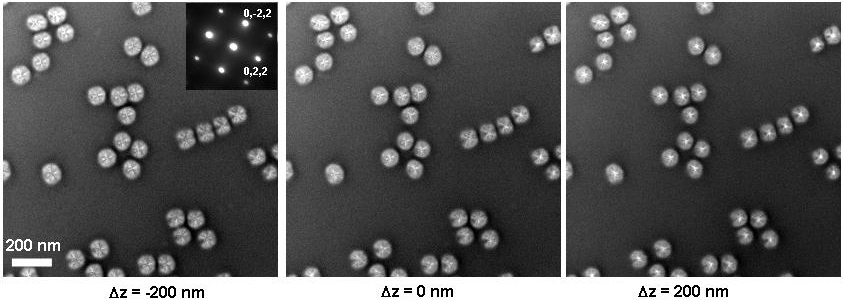
Fig. 1: Focus series TEM images of SiGe nanostructures deposited on Si (plane view sample prepared by chemical polishing on the Si side). Images were recorded at defocus -200 nm, 0, 200 nm. This defocus value gives the best compromise between image contrast and spatial resolution. For Δ=200 nm, the spatial resolution on the phase image is better than 5 nm. |
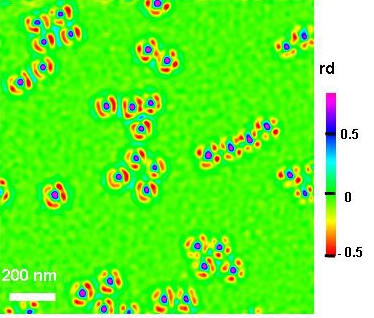
Fig. 2: Phase image retrieved from the focus series using the modified image processing. The SiGe nanopyramids show a positive phase central part with lobes of negative phase at the corner. Remarkably the negative lobes of neighbouring pyramids are close to contact along <200> directions or overlapping along <110> directions. |
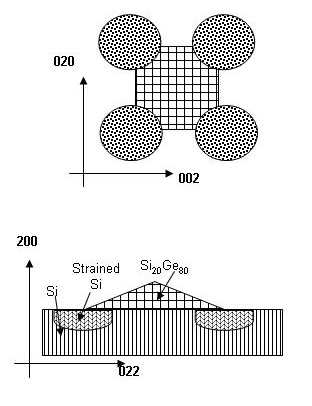
Fig. 3: Sketch of a cross section of a SiGe nanopyramid deposited on Si substrate summarizing the interpretation of the phase images. The positive phase central part is consistent with a Si20Ge80 pyramid while the negative phase lobes at the pyramid corners can be interpreted by local strains in the Si substrate. |
|