ID-10-P-1499 Towards reliable preparation of serial sections for correlative array tomography and 3D reconstruction
For 3D reconstructions of biological material array tomography (AT) is a relevant method [1]. To find special regions of interest (ROI) within a large volume correlative AT (CAT) allows defining ROIs in the light microscope first which are then imaged in an SEM. For CAT serial sections are usually placed on glass coverslips coated with indium tin oxide (ITO) to render the substrate conductive. To overcome the difficulties of collecting serial sections on that substrate we developed a mechanical multi-axes support on a commercial ultramicrotome, which allows us to reproducibly create large arrays of sections (Fig. 1A). At closer inspection (Fig. 1B) it is obvious that section thickness is not uniform. For qualitative 3D reconstructions such a systematic variation is not that important, one usually assumes the nominal thickness chosen at the ultramicrotome as section thickness for the 3D volume. However, if a quantitative statistical analysis is the aim of the study, e.g. of membrane topology, such as membrane area and curvature [2] exact section thicknesses are required. Furthermore, we found that nominal thickness from the ultramicrotome’s display not necessarily agrees with actual section thickness measured using an Atomic Force Microscope (AFM, Fig. 2). Currently we are investigating these variances in more detail (e.g. temperature impact caused by environment, operator and system).
To achieve more reliable and quantitative 3D reconstructions we propose to monitor section thickness during sectioning with a digital camera. This approach utilizes the thin film interference effect, which causes the sections to be colored depending on their thickness (Fig. 3 A) [3]. A mathematical model is obtained by first measuring section thickness with an AFM (Fig. 2). These values are then correlated with the color values given by the camera (Fig. 3 B). In that way it is possible to record the thickness of every section during the cutting process. However, as shown in Fig. 3b, for the lower end of the typical ultrathin range (50-100 nm) discrimination by color information is sensitive to minimal variations of the detected spectral intensities at the camera chip. Investigations towards e.g. calibrated illumination and spectral characterization of the complete optical path (including camera) are ongoing. Due to this limitation quantitative color-based analysis is at the moment only possible for sections thicker than 100 nm. For high resolution AT of thicker sections FIB milling provides an alternative approach (cf IMC 2014 abstracts, Wacker et al., Schröder et al.).
References
[1] Wacker and Schröder (2013), J Microscopy 252, 93-99
[2] Leitte et al., EuroVis 2013, 32, No 3
[3] Parthasarathy et al., IEEE Proc. ICRA 1987, No 4
We acknowledge funding by HEiKA and the German Federal Ministry for Education and Research, project NanoCombine, grant FKZ: 13N11401.
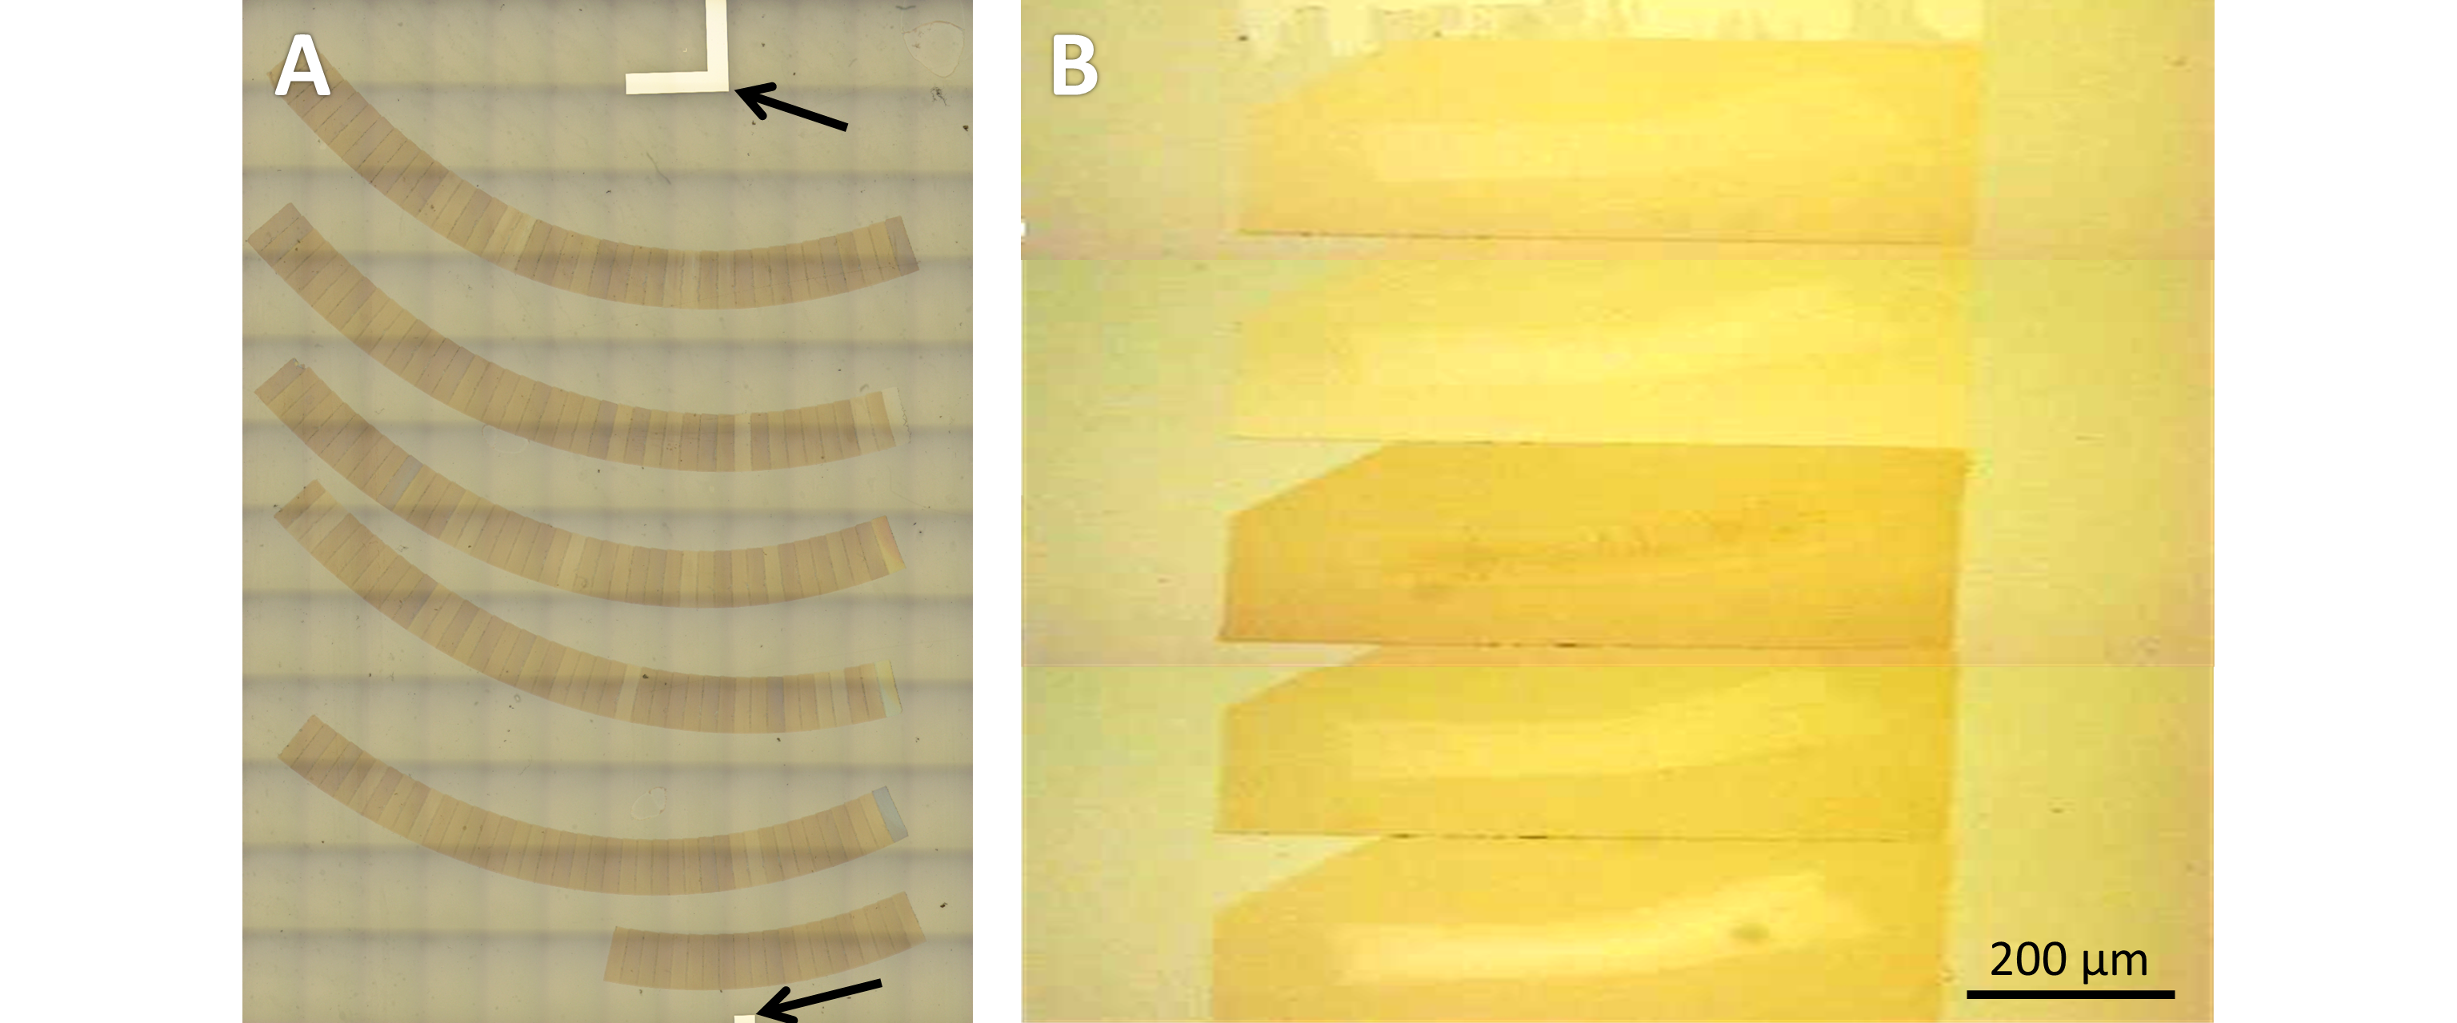
Fig. 1: Thickness variations in serial sectioning: 220 serial sections (A) placed on ITO-coated glass coverslip for CAT between alignment markers (arrows); close-up of sections (B). |
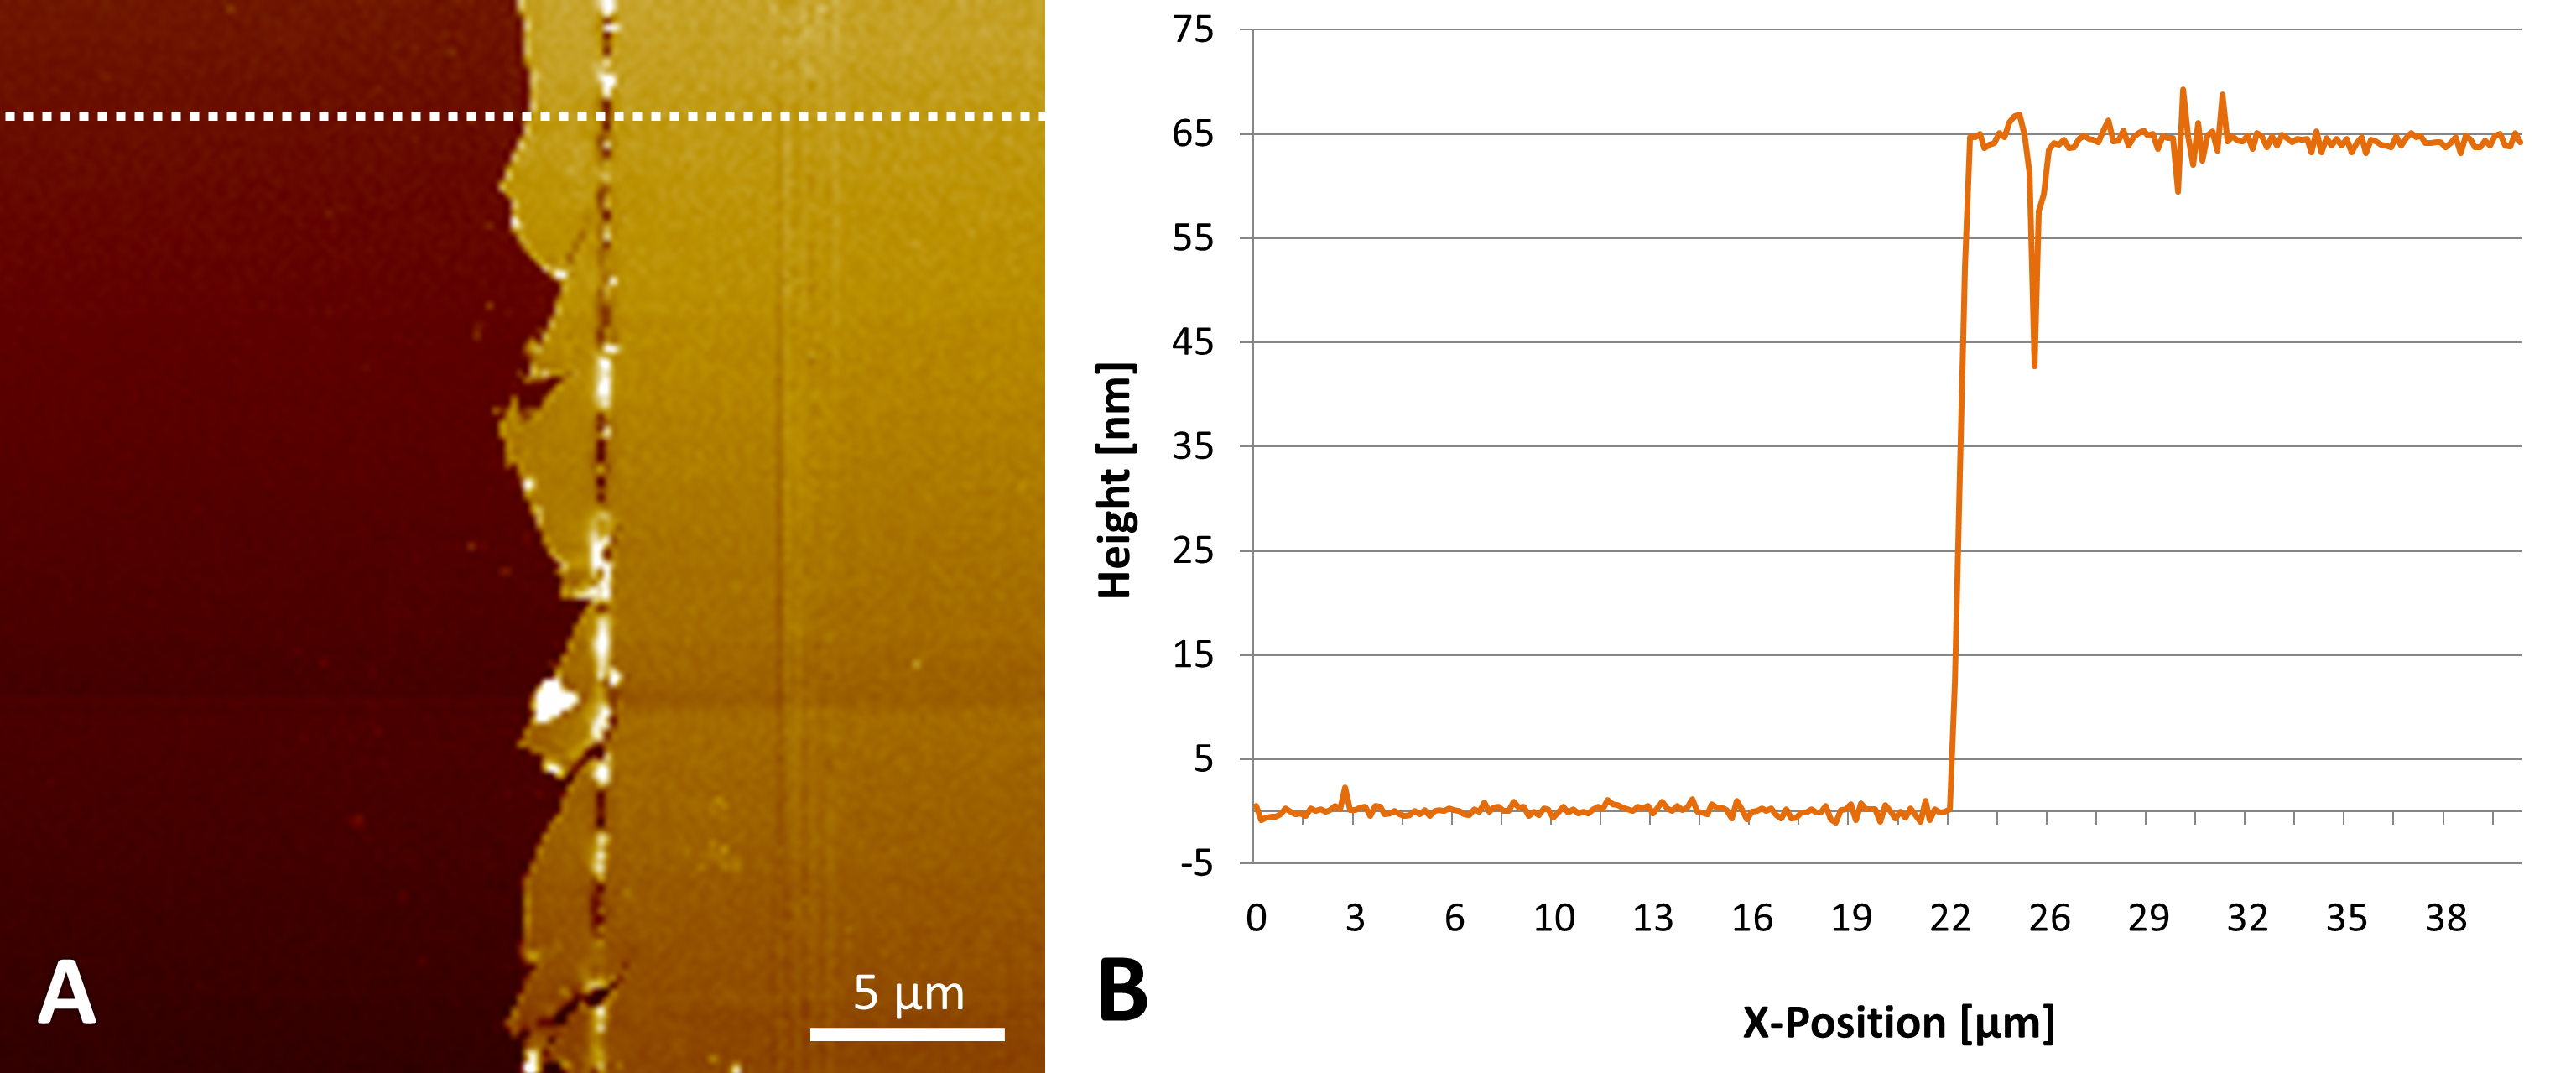
Fig. 2: Thickness profile of a section: Thickness measurement (B) obtained from the AFM image (A: along dotted line) |
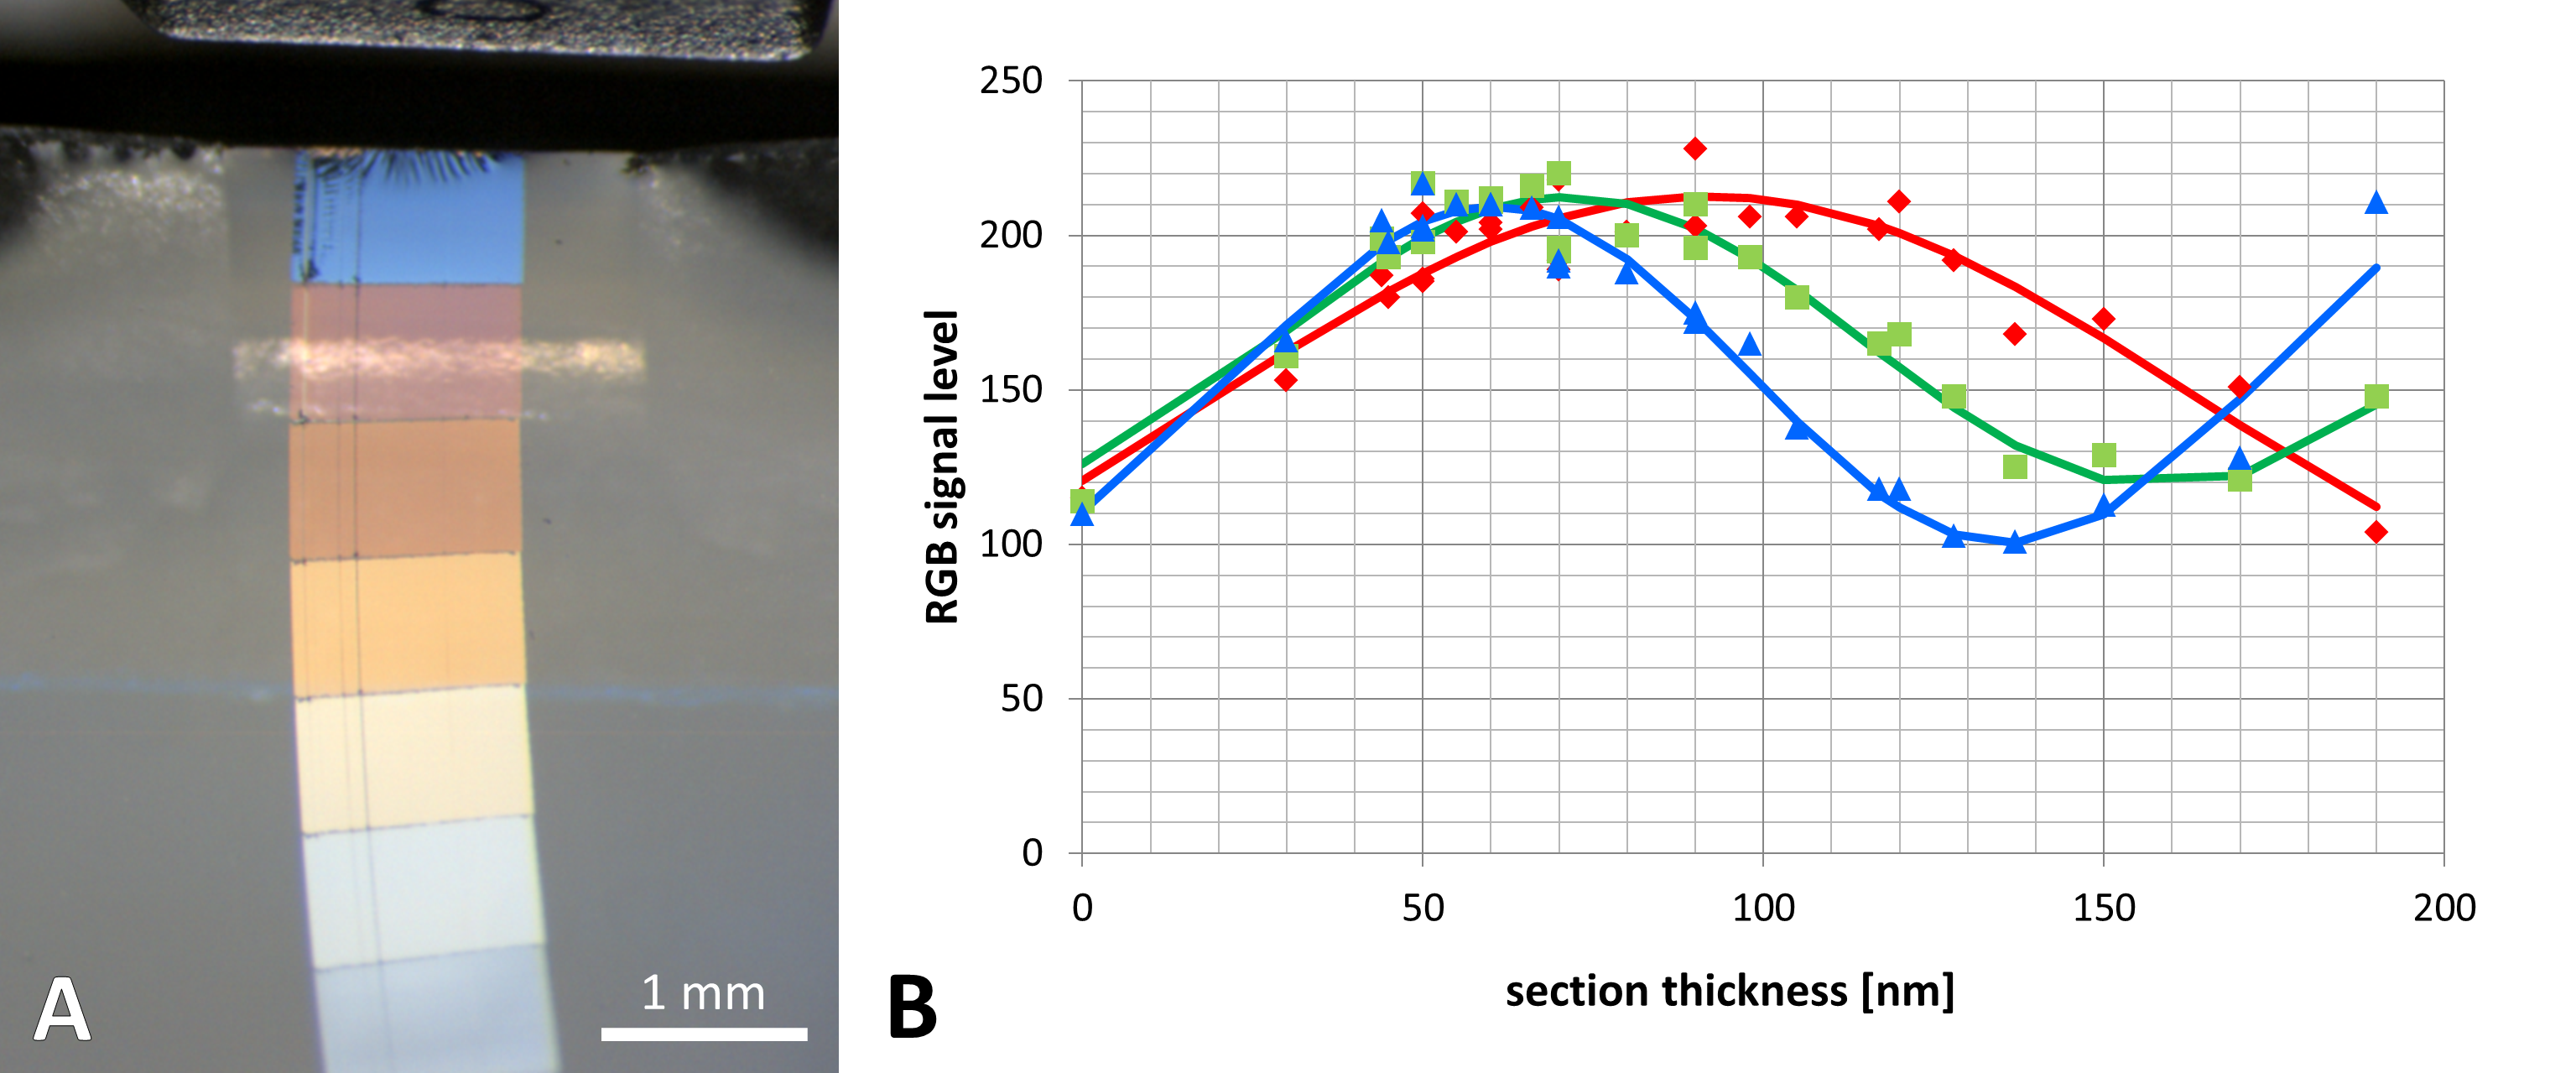
Fig. 3: Colors of sections on water surface of knife boat (A) - nominal section thickness grows from bottom (50 nm) to top (190 nm). Correlation between thickness and RGB signal levels (B) of digital camera. |
|