IT-10-P-1482 Accuracy and applications of electron-beam deposited nano-dot fiducial markers in electron tomography of rod-shaped specimens
Electron tomography is a method employed in a transmission electron microscope (TEM) to reconstruct a three-dimensional (3D) volume from a series of images acquired at suitable tilt increments. An easy, accurate alignment of the series is critical to obtain good quality 3D reconstruction of the sample. For tomography of biological samples, Au nanoparticles are usually used as fiducial markers, which are randomly placed on the sample from a suspension. For precise alignment, markers must be uniformly dispersed over the observed region of the specimen. However, it is difficult to obtain even dispersion because the colloidal Au nanoparticles are usually dense materials. On the other hand, for high resolution imaging of nanomaterials, rod-shaped specimen is usually used, because it allows us to obtain data without missing wedge.. It is, however, difficult to disperse colloidal Au nano-particles near the observing area while not interfering with the objects of interest in such samples. Electron-beam fabricated tungsten nano-dot fiducial markers, deposited in a standard scanning electron microscope with a gas delivery system, allows placing the fiducial markers at nearby locations that do not interfere with the area of interest. In particular we discuss the accuracy of alignment using the nano-dot fiducial markers and demonstrate the application of the method to some rod-shaped specimens with nanoparticles.
<Sample> An example of a typical rod-shaped specimen with Ag nanoparticles is shown in Fig. 1a. The rod-shaped specimens were fabricated by focused ion beam. Nano-dot markers were fabricated onto the specimen using electron beam induced-deposition of tungsten from W(CO)6 precursor.
<Accuracy> As seen in Fig. 2a, the nano-dot markers have nearly parabolic cross section. However, for automatic detection of positions of markers, cross correlation of a radially symmetric template is typically used. To improve alignment accuracy, the shape of the template was changed to better reflect the shape of the markers and their projected shape for various tilts of the specimen, as shown in Fig. 1c. The total error in marker position over the entire tilt range is taken as the minimum root-mean-square (RMS) error between the expected and measured marker position in the projected images. Using the improved shape of template, the RMS error was reduced from 2 to 1.6 pixels compared to radially symmetric template.
<Reconstructed image> Figure 2b shows the cross-sectional image of Ag nanoparticles. Not only the rod shaped sample boundary appears sharp, but the individual Ag nanoparticles with less than 5 nm diameter are clearly visible in the reconstructed images.
We are grateful for financial support of AIST in Tsukuba, Japan and NINT / NRC in Canada. The ongoing support of Hitachi High Technologies Canada contributed to success of this work. We are indebted to Dr. Takashi Nakamura (AIST) for Ag NP sample preparation and Martin Kupsta for support and for assistance on the Hitachi NB 5000.
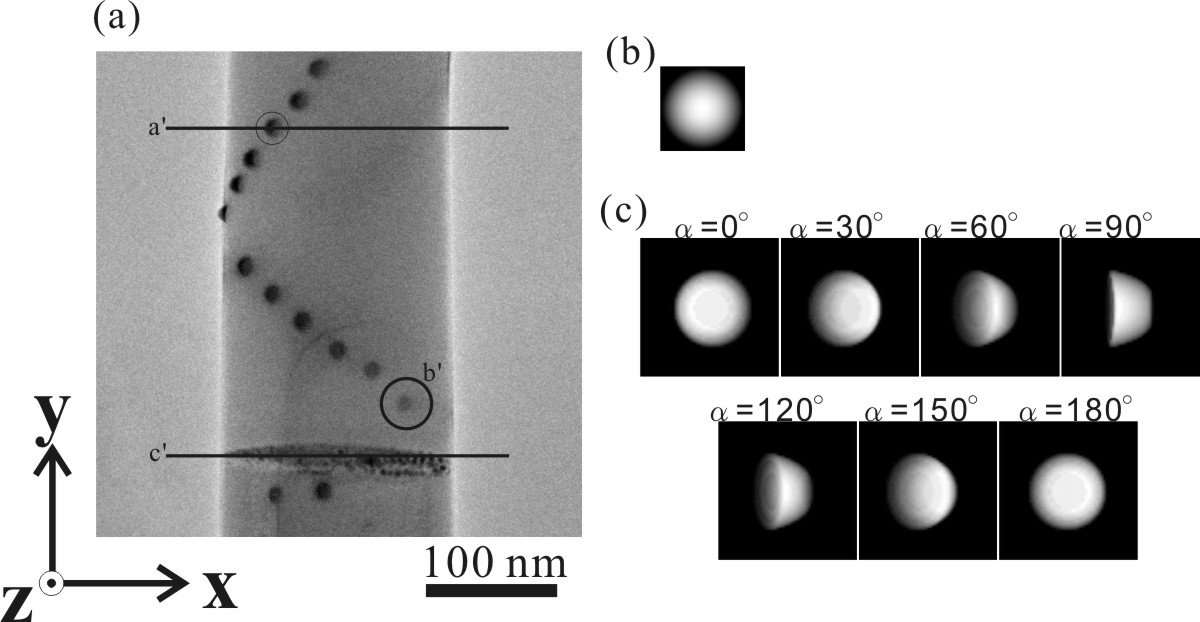
Fig. 1: (a)Image of the entire specimen. The regions are (starting from the top): amorphous carbon with nano-dot markers, ordered array of Ag nanoparticles, Si wafer substrate.(b) Radially symmetric template image.(c) Selected template image was modified to fit the shape to actual markers' shape at every tilt for every marker. |
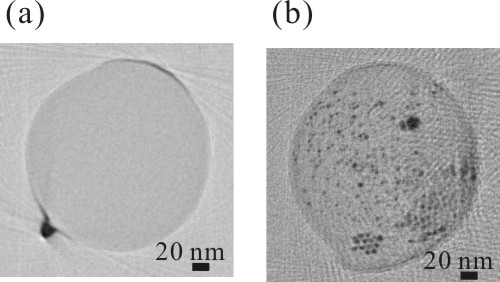
Fig. 2: Fig.2 (a),(b) a cross section of reconstructed volume of Ag nanoparticles in a plane perpendicular to the tilt axis. The plane of the cross section is marked in Fig1a. |