IT-4-O-1437 Advancements in Integrated Micro-XRF in the SEM
In recent years, small x-ray tubes have been modified for mounting on Scanning Electron Microscopes. There have been two main types: low-power miniature tubes mounted re-entrantly within the SEM [1], and higher-power tubes with integrated x-ray optics to produce smaller beam spots at the sample, yet with intensities high enough for routine analytical work [1,2]. This addition allows samples to be analyzed both by X-Ray Fluorescence (XRF), and by the electron beam (SEM-EDS), as illustrated by the two spectra in FIG. 1.
Both techniques can be used independently or together by taking sequential e-beam and x-ray excited spectra. Quantitative analysis using this combined approach was first shown at the IMC16 conference in Sapporo [3]. This approach uses the advantage of e-beam excitation for lighter elements below 2.0 keV, and the more-efficient XRF excitation for x-ray lines above 2.0 keV. Micro-XRF with X-Y stage scanning can be used to collect x-ray elemental maps similar to those collected with e-beams, except the stage is moved versus scanning of the beam. This Micro-XRF mapping method has been proposed for some time [e.g.4], and was first commercially demonstrated in 1986 [5]. It is possible to collect e-beam and x-ray excited maps simultaneously for combined qualitative x-ray elemental mapping.
Currently 40µm and 10µm x-ray beam spot sizes are available inside the SEM. The 10µm beam has shown count rates that exceed 2000cps on steel. Future expectations are of even smaller excitation areas, with “useful” x-ray count rates. To create a smaller spot the polycapillary optic needs to be more tightly focussed. This means that the Focal (working) Distance (FD) of the XRF source must be shorter. For example, for a 40µm spot, an FD of 11 mm is typical. With a 10µm excitation spot, an FD of about 4.5 mm is required, making the integration of the x-ray beam a bit more of a challenge (FIG. 2).
It is now possible to use primary filters (thin foils) in front of the x-ray source. Using an automated filter wheel, allows in situ tuning of the x-ray source spectrum [e.g. 4], with improved elemental detection limits. An automated filter wheel between the x-ray source and sample provides comparable capabilities to those in benchtop XRF. FIG. 3 shows a comparison of unfiltered and filtered spectra, showing how the overall “shape” can be varied to optimize sensitivities and peak-to-background ratios.
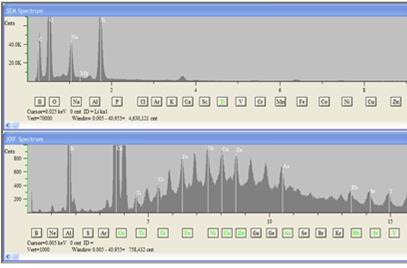
Fig. 1: EDS (top) and Micro-XRF (bottom) spectra of NIST SRM 610 |
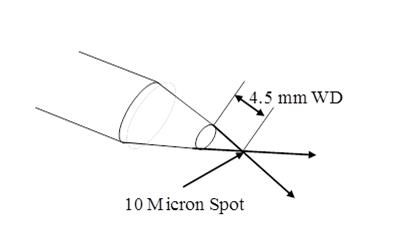
Fig. 2: Illustrates Focal Point and Working Distance |
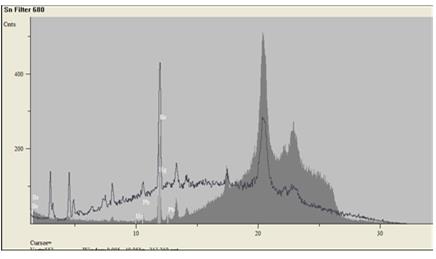
Fig. 3: Filtered Micro-XRF in SEM Spectrum |
|